
ATT Inc.: wave analysis
25 May 2018, 09:41
| Scenario | |
|---|---|
| Timeframe | Weekly |
| Recommendation | SELL |
| Entry Point | 32.77 |
| Take Profit | 29.80, 29.00 |
| Stop Loss | 33.57 |
| Key Levels | 29.00, 29.80, 33.57, 36.36 |
| Alternative scenario | |
|---|---|
| Recommendation | BUY STOP |
| Entry Point | 33.60 |
| Take Profit | 36.36 |
| Stop Loss | 32.70 |
| Key Levels | 29.00, 29.80, 33.57, 36.36 |
The price can fall.
On the 4-hour chart, the downward correction of the higher level is developing as a wave (2) of the higher level. Now the fifth wave of the lower level v of C of (2) is forming, within which the wave (iii) of v is developing. If the assumption is correct, the price will fall to the levels of 29.80–29.00. The level of 33.57 is critical and stop-loss for this scenario.
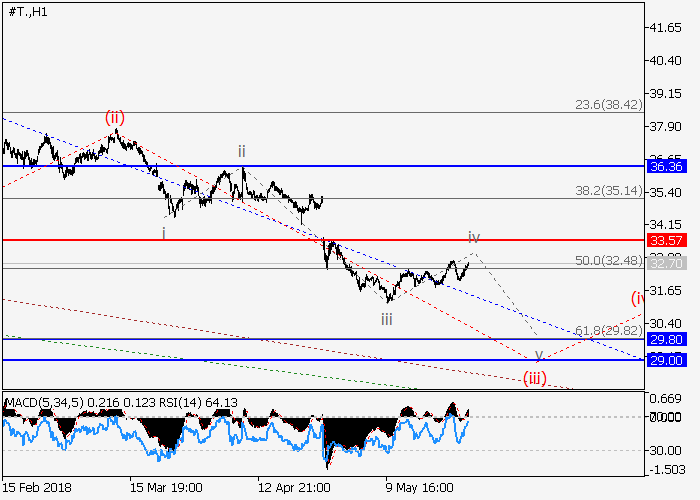
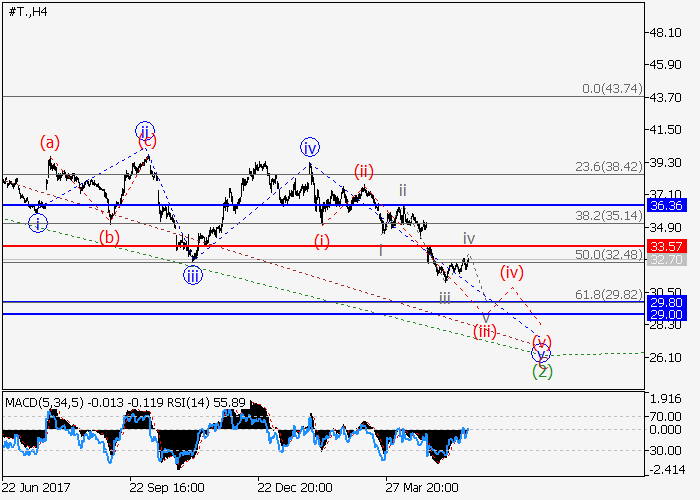
Main scenario
Short positions will become relevant during the correction, below the level of 33.57 with the targets at 29.80–29.00. Implementation period: 5–7 days.
Alternative scenario
The breakout and the consolidation of the price above the level of 33.57 will let the price grow to the level of 36.36.
On the 4-hour chart, the downward correction of the higher level is developing as a wave (2) of the higher level. Now the fifth wave of the lower level v of C of (2) is forming, within which the wave (iii) of v is developing. If the assumption is correct, the price will fall to the levels of 29.80–29.00. The level of 33.57 is critical and stop-loss for this scenario.
Main scenario
Short positions will become relevant during the correction, below the level of 33.57 with the targets at 29.80–29.00. Implementation period: 5–7 days.
Alternative scenario
The breakout and the consolidation of the price above the level of 33.57 will let the price grow to the level of 36.36.


No comments:
Write comments