
Intel Corp.: wave analysis
25 May 2018, 09:39
| Scenario | |
|---|---|
| Timeframe | Weekly |
| Recommendation | BUY |
| Entry Point | 54.74 |
| Take Profit | 59.00 |
| Stop Loss | 53.37 |
| Key Levels | 47.13, 50.77, 53.37, 59.00 |
| Alternative scenario | |
|---|---|
| Recommendation | SELL STOP |
| Entry Point | 53.30 |
| Take Profit | 50.77, 47.13 |
| Stop Loss | 54.15 |
| Key Levels | 47.13, 50.77, 53.37, 59.00 |
The trend is upward.
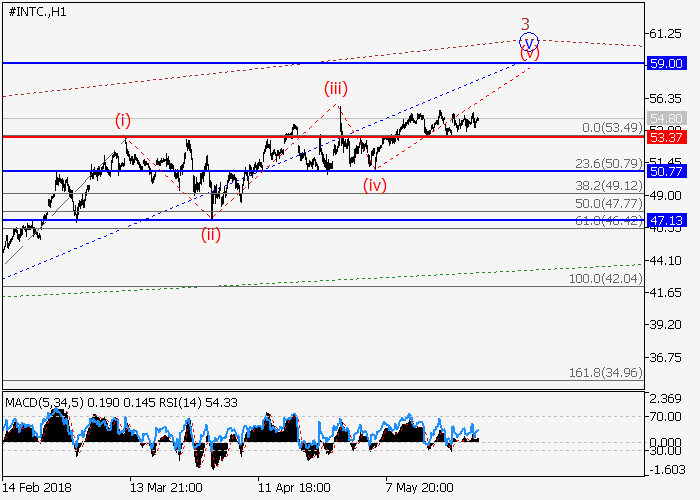
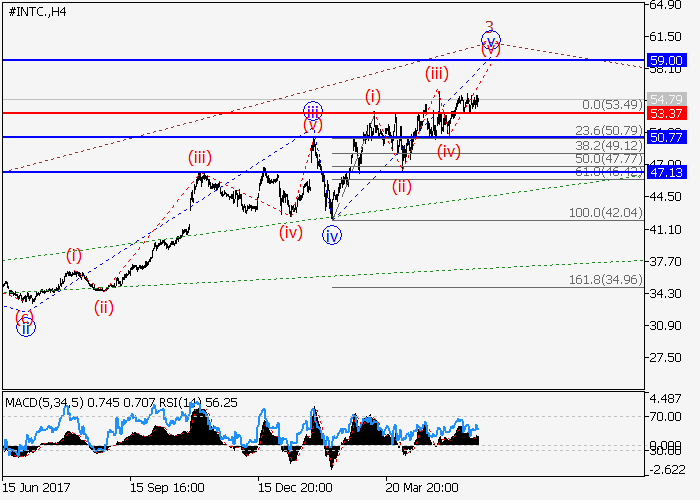
On the 4-hour chart, the upward momentum is forming within the third wave 3 of the higher level. Locally the wave v of 3 is developing, within which the fifth wave of the lower level (v) of v is forming. If the assumption is correct, the price will grow to the level of 59.00. The level of 53.37 is critical and stop-loss for this scenario.
Main scenario
Long positions will become relevant during the correction, above the level of 53.37 with the target at 59.00. Implementation period: 5–7 days.
Alternative scenario
The breakdown and the consolidation of the price below the level of 53.37 will let the price go down to the levels of 50.77–47.13.


No comments:
Write comments