
XAG/USD: silver prices are consolidating
09 April 2018, 10:05
| Scenario | |
|---|---|
| Timeframe | Intraday |
| Recommendation | BUY STOP |
| Entry Point | 16.37 |
| Take Profit | 16.51, 16.60 |
| Stop Loss | 16.25 |
| Key Levels | 16.03, 16.09, 16.13, 16.20, 16.27, 16.34, 16.44, 16.51, 16.60 |
| Alternative scenario | |
|---|---|
| Recommendation | SELL STOP |
| Entry Point | 16.15 |
| Take Profit | 16.09, 16.03, 16.00 |
| Stop Loss | 16.30 |
| Key Levels | 16.03, 16.09, 16.13, 16.20, 16.27, 16.34, 16.44, 16.51, 16.60 |
Current trend
Silver prices showed moderate growth at the trading last Friday, receiving support from weaker than expected data on the US labor market.
In addition, commodities were supported by another aggravation of trade relations between the US and China, after Donald Trump ordered to create a new list of Chinese goods to raise import duties worth USD 100 billion.
The weakest growth in the number of new jobs in the US over the past six months significantly reduced the expectations of those investors who were counting on increasing the rate of US monetary policy tightening. Moreover, some analysts believe that the pace may even decline.
Support and resistance
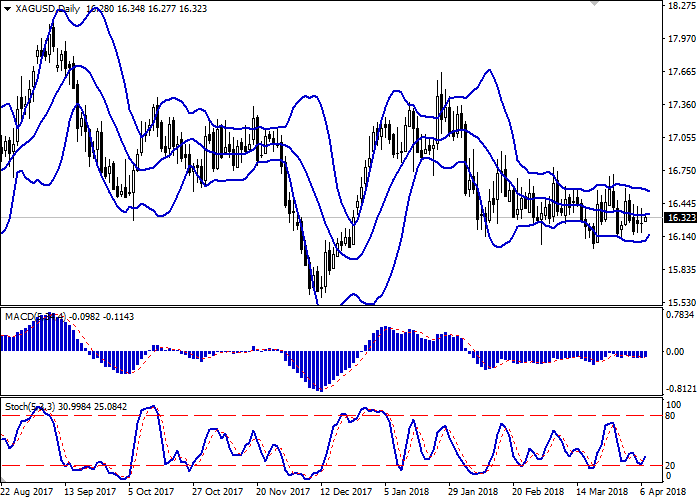
Bollinger Bands in D1 chart demonstrate flat dynamics. The price range is actively narrowing, reflecting the emergence of mixed dynamics in recent days.
MACD indicator is growing preserving a weak buy signal (histogram is above the signal line).
Stochastic, having rebounded from the "20" mark, turned in the direction of growth, reacting to the "bullish" start of trading today.
At the moment, the indicator does not contradict the further development of the "bullish" trend in the short and/or ultra-short term. Nevertheless, to open more long-term purchases, one should wait for the appearance of additional trading signals.
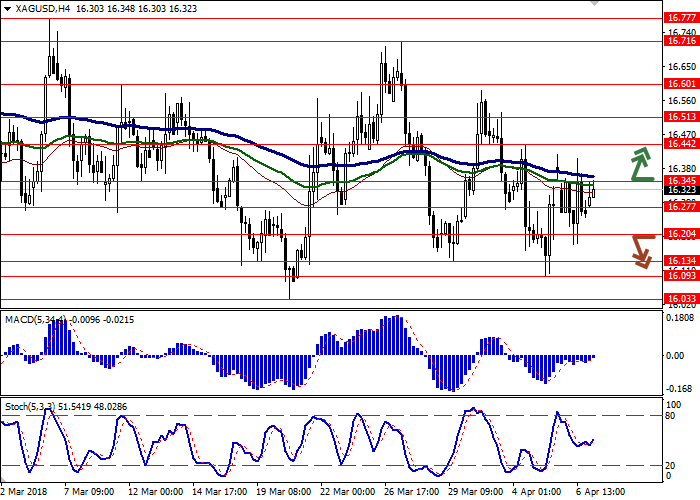
Resistance levels: 16.34, 16.44, 16.51, 16.60.
Support levels: 16.27, 16.20, 16.13, 16.09, 16.03.
Trading tips
To open long positions one can rely on the breakout of the level of 16.34, while maintaining "bullish" signals from technical indicators. Take-profit – 16.51–16.60. Stop-loss – 16.25. Implementation period: 2-3 days.
The return of the "bearish" trend to the market with a breakdown of the level of 16.20 may be an alternative. In this case, the targets of the "bears" may be located around 16.09 or 16.03–16.00 marks. Stop-loss – 16.30. Implementation period: 2-4 days.
Silver prices showed moderate growth at the trading last Friday, receiving support from weaker than expected data on the US labor market.
In addition, commodities were supported by another aggravation of trade relations between the US and China, after Donald Trump ordered to create a new list of Chinese goods to raise import duties worth USD 100 billion.
The weakest growth in the number of new jobs in the US over the past six months significantly reduced the expectations of those investors who were counting on increasing the rate of US monetary policy tightening. Moreover, some analysts believe that the pace may even decline.
Support and resistance
Bollinger Bands in D1 chart demonstrate flat dynamics. The price range is actively narrowing, reflecting the emergence of mixed dynamics in recent days.
MACD indicator is growing preserving a weak buy signal (histogram is above the signal line).
Stochastic, having rebounded from the "20" mark, turned in the direction of growth, reacting to the "bullish" start of trading today.
At the moment, the indicator does not contradict the further development of the "bullish" trend in the short and/or ultra-short term. Nevertheless, to open more long-term purchases, one should wait for the appearance of additional trading signals.
Resistance levels: 16.34, 16.44, 16.51, 16.60.
Support levels: 16.27, 16.20, 16.13, 16.09, 16.03.
Trading tips
To open long positions one can rely on the breakout of the level of 16.34, while maintaining "bullish" signals from technical indicators. Take-profit – 16.51–16.60. Stop-loss – 16.25. Implementation period: 2-3 days.
The return of the "bearish" trend to the market with a breakdown of the level of 16.20 may be an alternative. In this case, the targets of the "bears" may be located around 16.09 or 16.03–16.00 marks. Stop-loss – 16.30. Implementation period: 2-4 days.


No comments:
Write comments