XAG/USD: silver price is growing
03 April 2018, 09:53
| Scenario | |
|---|---|
| Timeframe | Intraday |
| Recommendation | BUY |
| Entry Point | 16.53 |
| Take Profit | 16.60, 16.65 |
| Stop Loss | 16.40 |
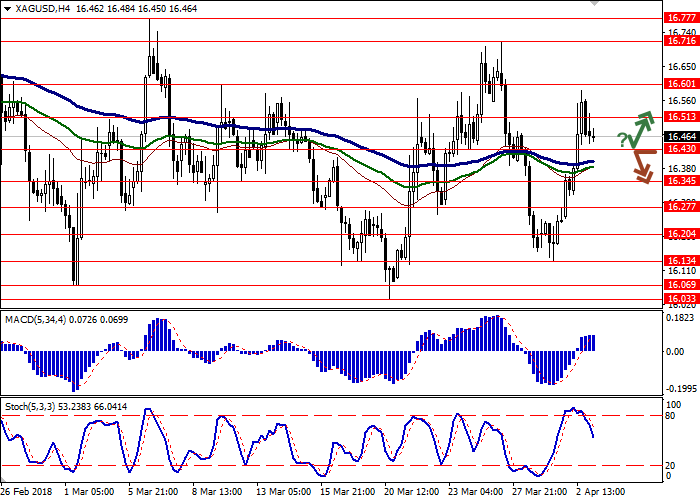
| Key Levels | 16.20, 16.27, 16.34, 16.43, 16.51, 16.60, 16.71, 16.77 |
| Alternative scenario | |
|---|---|
| Recommendation | SELL STOP |
| Entry Point | 16.40 |
| Take Profit | 16.30, 16.27 |
| Stop Loss | 16.50 |
| Key Levels | 16.20, 16.27, 16.34, 16.43, 16.51, 16.60, 16.71, 16.77 |
Current trend
Yesterday silver prices significantly grew and balanced the fall at the end of the last trading week. The fears of new crisis in the financial markets and poor US statistics supported the instrument.
The metal is sensitive to the tightness of the USA and China trade relations change. Yesterday Beijing implied 25% fees on the import of pork, fruits and a range of other American goods in reply to US corresponding measures. The analysts consider it as an intention to improve the positions in the upcoming trade negotiations with the USA.
Support and resistance
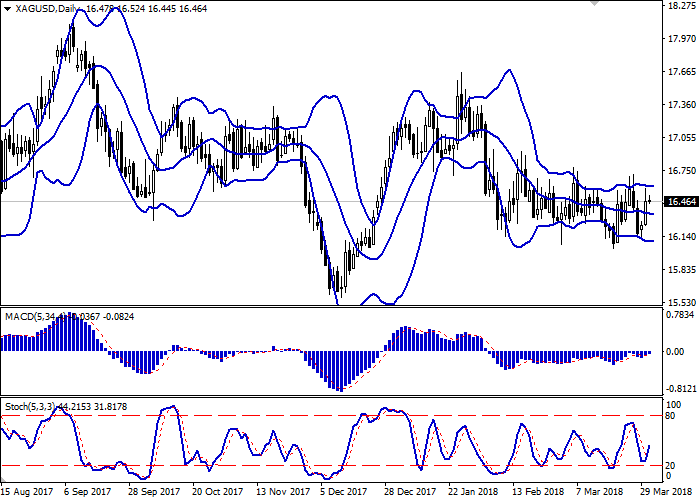
On the daily chart, Bollinger Bands are trading flat. The price range is almost the same, being quite wide for the current activity level.
MACD is growing, keeping a weak buy signal (the histogram is above the signal line). The indicator is now ready to test the zero line.
Stochastic’s dynamic is the same; it reversed upwards at the end of the last trading week.
The technical indicators’ readings do not contradict with the upward trend developing in the short term, but the channel strategy of Bollinger Bands restricts the growth potential.
Resistance levels: 16.51, 16.60, 16.71, 16.77.
Support levels: 16.43, 16.34, 16.27, 16.20.


Trading tips
Long positions can be opened after the rebound at the level of 16.43 and the breakout of the level 16.51 with the targets at 16.60–16.65 and stop loss 16.40.
Short positions can be opened after the breakdown of the level 16.43 with the targets at 16.30–16.27 and stop loss 16.50.
Implementation period: 2–3 days.
Yesterday silver prices significantly grew and balanced the fall at the end of the last trading week. The fears of new crisis in the financial markets and poor US statistics supported the instrument.
The metal is sensitive to the tightness of the USA and China trade relations change. Yesterday Beijing implied 25% fees on the import of pork, fruits and a range of other American goods in reply to US corresponding measures. The analysts consider it as an intention to improve the positions in the upcoming trade negotiations with the USA.
Support and resistance
On the daily chart, Bollinger Bands are trading flat. The price range is almost the same, being quite wide for the current activity level.
MACD is growing, keeping a weak buy signal (the histogram is above the signal line). The indicator is now ready to test the zero line.
Stochastic’s dynamic is the same; it reversed upwards at the end of the last trading week.
The technical indicators’ readings do not contradict with the upward trend developing in the short term, but the channel strategy of Bollinger Bands restricts the growth potential.
Resistance levels: 16.51, 16.60, 16.71, 16.77.
Support levels: 16.43, 16.34, 16.27, 16.20.


Trading tips
Long positions can be opened after the rebound at the level of 16.43 and the breakout of the level 16.51 with the targets at 16.60–16.65 and stop loss 16.40.
Short positions can be opened after the breakdown of the level 16.43 with the targets at 16.30–16.27 and stop loss 16.50.
Implementation period: 2–3 days.


No comments:
Write comments