AUD/USD: the pair is trading in both directions
03 April 2018, 09:41
| Scenario | |
|---|---|
| Timeframe | Intraday |
| Recommendation | BUY STOP |
| Entry Point | 0.7720 |
| Take Profit | 0.7767, 0.7800 |
| Stop Loss | 0.7680, 0.7674 |
| Key Levels | 0.7586, 0.7638, 0.7674, 0.7711, 0.7742, 0.7767, 0.7800 |
| Alternative scenario | |
|---|---|
| Recommendation | SELL STOP |
| Entry Point | 0.7670 |
| Take Profit | 0.7638, 0.7600 |
| Stop Loss | 0.7700, 0.7711 |
| Key Levels | 0.7586, 0.7638, 0.7674, 0.7711, 0.7742, 0.7767, 0.7800 |
Current trend
Yesterday, AUD showed a decline against USD, being under pressure from technical factors that developed due to the market closed on the occasion of the Easter holidays.
Today, the pair is trading with a steady uptrend, fully compensating for the decline the day before. Support for AUD is provided by good macroeconomic statistics from Australia, as well as the results of the RBA meeting, at which, as expected, the interest rate was maintained at the previous level of 1.5%. AiG Performance of Manufacturing Index in March rose from 57.5 to 63.1 points, which coincided with analysts' expectations. Positive dynamics was shown by the ANZ Job Advertisements Index. In March, the indicator was 0.0% after a decrease of 0.4% in February.
Support and resistance
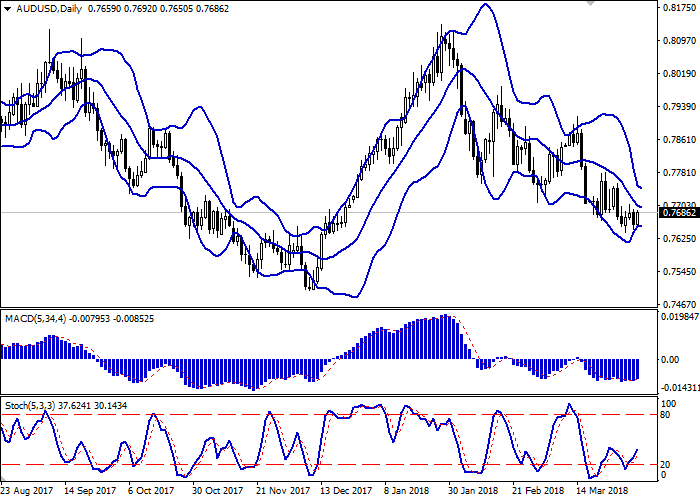
On the D1 chart Bollinger Bands are reversing horisontally. The price range is narrowing, reflecting the mixed nature of trading in recent days.
MACD indicator tries to reverse to growth and to form a new buy signal (the histogram has to consolidate above the signal line).
Stochastic shows a similar dynamics, maintaining growth of the end of last week.
The technical indicators show the possibility of a short-term uptrend in the near future.
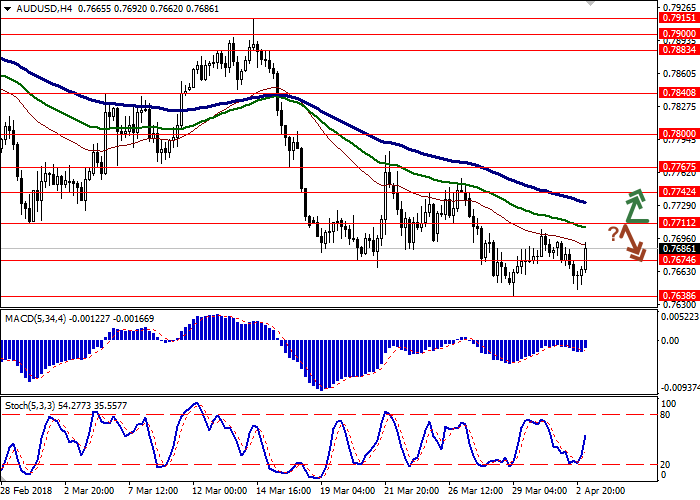
Resistance levels: 0.7711, 0.7742, 0.7767, 0.7800.
Support levels: 0.7674, 0.7638, 0.7586.


Trading tips
To open long positions one can rely on the breakout of the level of 0.7711, while maintaining "bullish" signals from technical indicators. Take-profit – 0.7767 or 0.7800. Stop-loss — 0.7680, 0.7674. Implementation period: 2-3 days.
The rebound from the level of 0.7711 as from resistance, with the subsequent breakdown of 0.7674 mark, can become a signal to the beginning of correctional sales with targets at 0.7638 or 0.7600. Stop-loss — 0.7700, 0.7711. Implementation period: 2-3 days.
Yesterday, AUD showed a decline against USD, being under pressure from technical factors that developed due to the market closed on the occasion of the Easter holidays.
Today, the pair is trading with a steady uptrend, fully compensating for the decline the day before. Support for AUD is provided by good macroeconomic statistics from Australia, as well as the results of the RBA meeting, at which, as expected, the interest rate was maintained at the previous level of 1.5%. AiG Performance of Manufacturing Index in March rose from 57.5 to 63.1 points, which coincided with analysts' expectations. Positive dynamics was shown by the ANZ Job Advertisements Index. In March, the indicator was 0.0% after a decrease of 0.4% in February.
Support and resistance
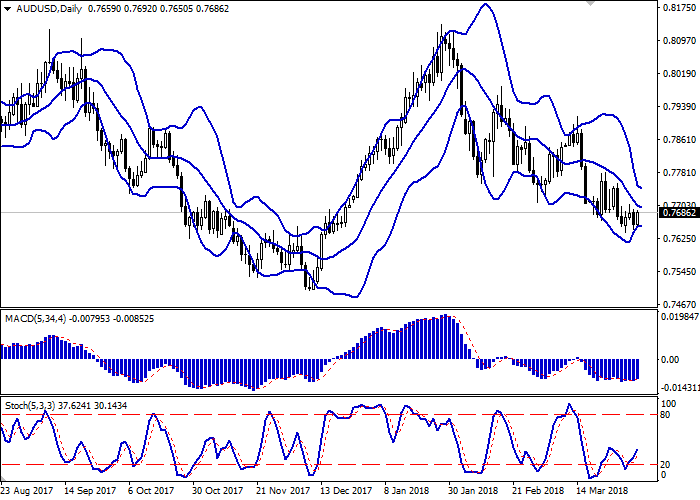
On the D1 chart Bollinger Bands are reversing horisontally. The price range is narrowing, reflecting the mixed nature of trading in recent days.
MACD indicator tries to reverse to growth and to form a new buy signal (the histogram has to consolidate above the signal line).
Stochastic shows a similar dynamics, maintaining growth of the end of last week.
The technical indicators show the possibility of a short-term uptrend in the near future.
Resistance levels: 0.7711, 0.7742, 0.7767, 0.7800.
Support levels: 0.7674, 0.7638, 0.7586.


Trading tips
To open long positions one can rely on the breakout of the level of 0.7711, while maintaining "bullish" signals from technical indicators. Take-profit – 0.7767 or 0.7800. Stop-loss — 0.7680, 0.7674. Implementation period: 2-3 days.
The rebound from the level of 0.7711 as from resistance, with the subsequent breakdown of 0.7674 mark, can become a signal to the beginning of correctional sales with targets at 0.7638 or 0.7600. Stop-loss — 0.7700, 0.7711. Implementation period: 2-3 days.


No comments:
Write comments