WTI Crude Oil: the price is strengthening
02 April 2018, 09:51
| Scenario | |
|---|---|
| Timeframe | Intraday |
| Recommendation | BUY STOP |
| Entry Point | 65.60 |
| Take Profit | 66.44 |
| Stop Loss | 65.00 |
| Key Levels | 61.73, 62.61, 63.26, 64.04, 65.50, 66.00, 66.44 |
| Alternative scenario | |
|---|---|
| Recommendation | SELL LIMIT |
| Entry Point | 65.50 |
| Take Profit | 64.04, 63.26 |
| Stop Loss | 66.00, 66.20 |
| Key Levels | 61.73, 62.61, 63.26, 64.04, 65.50, 66.00, 66.44 |
Current trend
At the end of the last trading week, oil prices grew, compensating a quite rapid decrease, and stepped off the local lows since March 21, supported by the hints upon the prolongation of OPEC oil production limitation Agreement until the end of 2018. Now the Agreement is one of the main balancing forces under the constant increase in US production.
Oil is under pressure of “bullish” USD moods and restored growth of US resources, which have surprisingly increased by 1.643 million barrel against the analysts’ expectation of the decrease by 0.287 million barrel.
Friday’s Baker Hughes data did not affect the market significantly, despite the decrease of US oil rig count from 804 to 798 units for the first time in a long while.
Support and resistance
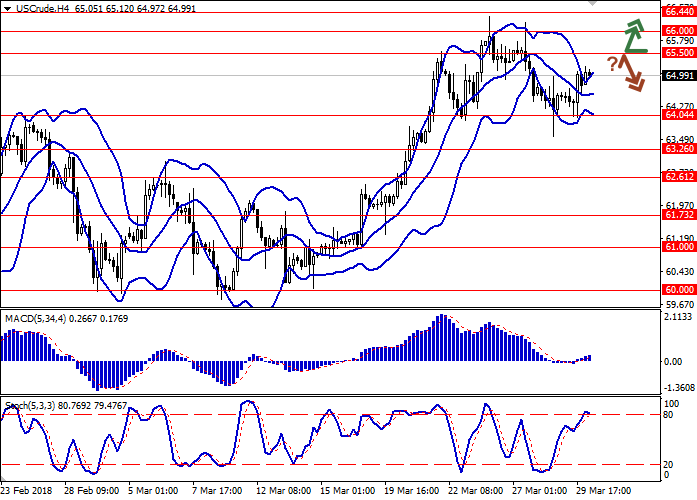
On the 4-hour chart, Bollinger Bands are trading flat. The price range is actively widening, but not as fast as the “bullish” dynamic is developing now.
MACD is growing, keeping a weak buy signal (the histogram is above the signal line).
Stochastic reached the level of 80 and reversed downwards; reacting to the mixed beginning of today’s trading session.
Resistance levels: 65.50, 66.00, 66.44.
Support levels: 64.04, 63.26, 62.61, 61.73.

Trading tips
Long positions can be opened after the breakout of the level 65.50 with the target at 66.44 and stop loss 65.00.
Short positions can be opened after the rebound at the level of 65.50 with the targets at 64.04 or 63.26 and stop loss 66.00, 66.20.
Implementation period: 2–3 days.
At the end of the last trading week, oil prices grew, compensating a quite rapid decrease, and stepped off the local lows since March 21, supported by the hints upon the prolongation of OPEC oil production limitation Agreement until the end of 2018. Now the Agreement is one of the main balancing forces under the constant increase in US production.
Oil is under pressure of “bullish” USD moods and restored growth of US resources, which have surprisingly increased by 1.643 million barrel against the analysts’ expectation of the decrease by 0.287 million barrel.
Friday’s Baker Hughes data did not affect the market significantly, despite the decrease of US oil rig count from 804 to 798 units for the first time in a long while.
Support and resistance
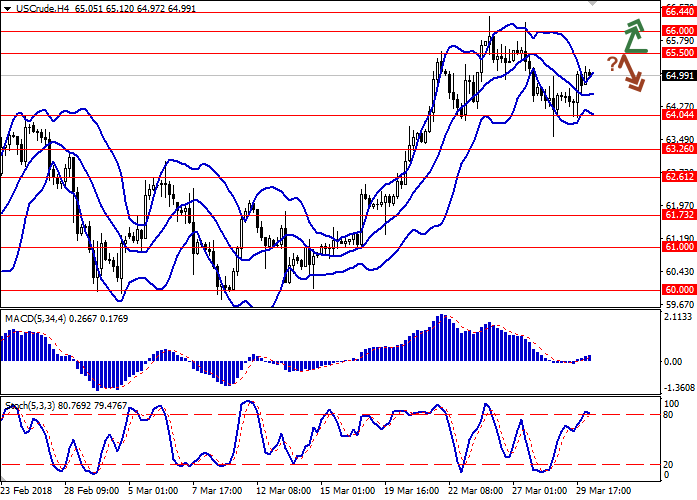
On the 4-hour chart, Bollinger Bands are trading flat. The price range is actively widening, but not as fast as the “bullish” dynamic is developing now.
MACD is growing, keeping a weak buy signal (the histogram is above the signal line).
Stochastic reached the level of 80 and reversed downwards; reacting to the mixed beginning of today’s trading session.
Resistance levels: 65.50, 66.00, 66.44.
Support levels: 64.04, 63.26, 62.61, 61.73.

Trading tips
Long positions can be opened after the breakout of the level 65.50 with the target at 66.44 and stop loss 65.00.
Short positions can be opened after the rebound at the level of 65.50 with the targets at 64.04 or 63.26 and stop loss 66.00, 66.20.
Implementation period: 2–3 days.


No comments:
Write comments