USD/JPY: the pair is showing mixed dynamics
02 April 2018, 09:37
| Scenario | |
|---|---|
| Timeframe | Intraday |
| Recommendation | BUY STOP |
| Entry Point | 106.50 |
| Take Profit | 107.00, 107.27 |
| Stop Loss | 106.10, 106.00 |
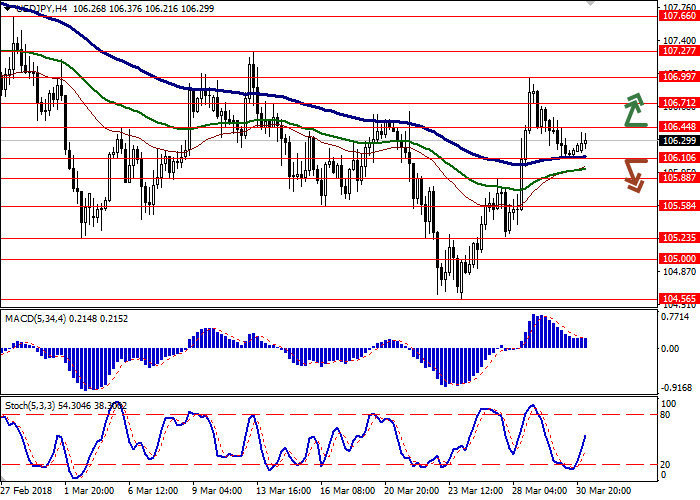
| Key Levels | 105.23, 105.58, 105.88, 106.10, 106.44, 106.71, 106.99, 107.27 |
| Alternative scenario | |
|---|---|
| Recommendation | SELL STOP |
| Entry Point | 106.00, 105.90 |
| Take Profit | 105.58, 105.23, 105.00 |
| Stop Loss | 106.50 |
| Key Levels | 105.23, 105.58, 105.88, 106.10, 106.44, 106.71, 106.99, 107.27 |
Current trend
Today, USD shows a slight increase against JPY, offsetting the decline of the end of last week. Market activity due to the Easter holidays remains quite low, but traders are gradually returning to the market. Today, investors focus on a block of macroeconomic statistics from Japan.
According to the Bank of Japan Tankan report, the manufacturing PMI for large enterprises of all industries in Q1 2018 grew by 2.3% after growth of 6.4% in the previous quarter. Analysts expected a much weaker growth: +0.6%. In turn, the PMI forecast for large manufacturers fell from 21 to 20 points and the Non-Manufacturing Index fell from 25 to 23 points (with the forecast of 24 points).
Support and resistance
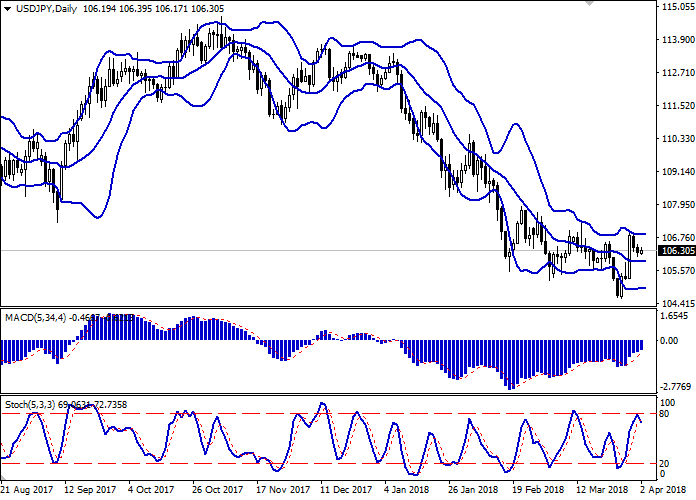
Bollinger Bands in D1 chart demonstrate flat dynamics. The price range has consolidated, but remains quite spacious for the current level of activity on the instrument.
MACD indicator is growing preserving a buy signal (the histogram is above the signal line).
Stochastic, in turn, having reached the mark of "80", is trying to turn into a downward correction, reacting to the emergence of "bearish" sentiments at the end of the last trading week.
The technical indicators remain contradictory; therefore it is better to wait until the situation becomes clearer.
Resistance levels: 106.44, 106.71, 106.99, 107.27.
Support levels: 106.10, 105.88, 105.58, 105.23.


Trading tips
To open long positions one can rely on the breakout of the level of 106.44, while maintaining "bullish" signals from technical indicators. Take-profit – 107.00–107.27. Stop-loss — 106.10–106.00. Implementation period: 2-3 days.
Return of the “bearish” trend to the market with a breakdown of 106.10–106.00 mark may be a signal for sales with targets at 105.58 or 105.23–105.00. Stop-loss – 106.50. Implementation period: 2-3 days.
Today, USD shows a slight increase against JPY, offsetting the decline of the end of last week. Market activity due to the Easter holidays remains quite low, but traders are gradually returning to the market. Today, investors focus on a block of macroeconomic statistics from Japan.
According to the Bank of Japan Tankan report, the manufacturing PMI for large enterprises of all industries in Q1 2018 grew by 2.3% after growth of 6.4% in the previous quarter. Analysts expected a much weaker growth: +0.6%. In turn, the PMI forecast for large manufacturers fell from 21 to 20 points and the Non-Manufacturing Index fell from 25 to 23 points (with the forecast of 24 points).
Support and resistance
Bollinger Bands in D1 chart demonstrate flat dynamics. The price range has consolidated, but remains quite spacious for the current level of activity on the instrument.
MACD indicator is growing preserving a buy signal (the histogram is above the signal line).
Stochastic, in turn, having reached the mark of "80", is trying to turn into a downward correction, reacting to the emergence of "bearish" sentiments at the end of the last trading week.
The technical indicators remain contradictory; therefore it is better to wait until the situation becomes clearer.
Resistance levels: 106.44, 106.71, 106.99, 107.27.
Support levels: 106.10, 105.88, 105.58, 105.23.


Trading tips
To open long positions one can rely on the breakout of the level of 106.44, while maintaining "bullish" signals from technical indicators. Take-profit – 107.00–107.27. Stop-loss — 106.10–106.00. Implementation period: 2-3 days.
Return of the “bearish” trend to the market with a breakdown of 106.10–106.00 mark may be a signal for sales with targets at 105.58 or 105.23–105.00. Stop-loss – 106.50. Implementation period: 2-3 days.


No comments:
Write comments