USD/JPY: consolidation will be replaced by growth
03 April 2018, 14:51
| Scenario | |
|---|---|
| Timeframe | Intraday |
| Recommendation | BUY LIMIT |
| Entry Point | 105.60, 105.00, 104.50 |
| Take Profit | 107.30, 109.85, 110.50 |
| Stop Loss | 103.50 |
| Key Levels | 102.50, 103.70, 104.30, 104.50, 105.60, 105.00, 106.10, 106.80, 107.30, 107.75, 108.15, 108.45, 109.00, 109.55, 109.85, 110.50 |
Current trend
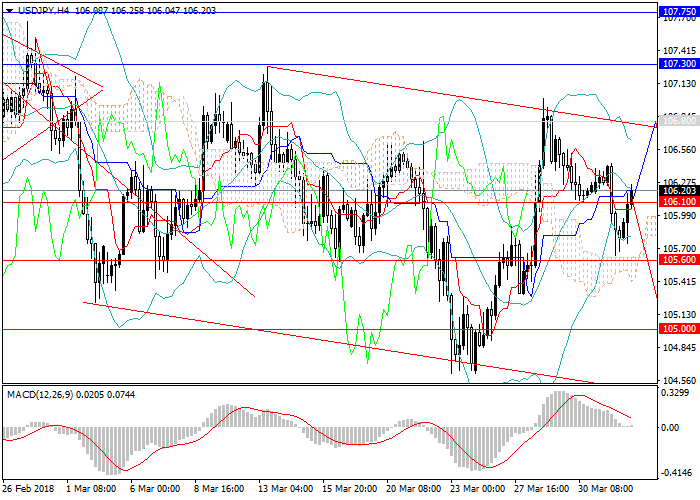
In March, long-term downward dynamics was replaced by lateral consolidation.
USD again becomes attractive to investors, and demand for the yen is declining, which was high due to the use of the Japanese currency as a "safe haven". At the end of March, the pair tested a new local minimum, but hastily returned to the channel and showed significant growth. In early April, the instrument went down, but then returned to 106.10, 106.20 marks.
The yen is also pressured by a weak fundamental background. Yesterday, data on the decline in business activity indices in the manufacturing sector, activity in the sector of large producers, and in the non-production sector was published. In the second half of the week will be published US data on the change in nonfarm productivity, the unemployment rate and repeated applications for unemployment benefits. Japan will respond with releases on changes in the level of wages, and the index of coinciding and leading indicators.
Support and resistance
In the short term, further slight growth is expected to the level of 106.80, after which a new downward wave will be formed. In the medium term, the pair will consolidate with a high probability of an uptrend in Q2 (to 109.85, 110.50). Further tightening of Fed’s monetary policy will strengthen the USD and ensure the growth of the pair.
Technical indicators on D1 chart confirm growth forecasts: MACD indicates a rapid decline in the volume of short positions, and Bollinger Bands are reversing up.
Support levels: 106.10, 105.60, 105.00, 104.50, 104.30, 103.70, 102.50.
Resistance levels: 106.80, 107.30, 107.75, 108.15, 108.45, 109.00, 109.55, 109.85, 110.50.

Trading tips
In the current situation, one may increase long positions from 105.60, 105.00, 104.50 with targets at 107.30, 109.85, 110.50 and stop-loss at 103.50.
In March, long-term downward dynamics was replaced by lateral consolidation.
USD again becomes attractive to investors, and demand for the yen is declining, which was high due to the use of the Japanese currency as a "safe haven". At the end of March, the pair tested a new local minimum, but hastily returned to the channel and showed significant growth. In early April, the instrument went down, but then returned to 106.10, 106.20 marks.
The yen is also pressured by a weak fundamental background. Yesterday, data on the decline in business activity indices in the manufacturing sector, activity in the sector of large producers, and in the non-production sector was published. In the second half of the week will be published US data on the change in nonfarm productivity, the unemployment rate and repeated applications for unemployment benefits. Japan will respond with releases on changes in the level of wages, and the index of coinciding and leading indicators.
Support and resistance
In the short term, further slight growth is expected to the level of 106.80, after which a new downward wave will be formed. In the medium term, the pair will consolidate with a high probability of an uptrend in Q2 (to 109.85, 110.50). Further tightening of Fed’s monetary policy will strengthen the USD and ensure the growth of the pair.
Technical indicators on D1 chart confirm growth forecasts: MACD indicates a rapid decline in the volume of short positions, and Bollinger Bands are reversing up.
Support levels: 106.10, 105.60, 105.00, 104.50, 104.30, 103.70, 102.50.
Resistance levels: 106.80, 107.30, 107.75, 108.15, 108.45, 109.00, 109.55, 109.85, 110.50.

Trading tips
In the current situation, one may increase long positions from 105.60, 105.00, 104.50 with targets at 107.30, 109.85, 110.50 and stop-loss at 103.50.


No comments:
Write comments