Brent Crude Oil: general review
03 April 2018, 15:33
| Scenario | |
|---|---|
| Timeframe | Intraday |
| Recommendation | SELL STOP |
| Entry Point | 67.10 |
| Take Profit | 66.40, 65.62 |
| Stop Loss | 67.60 |
| Key Levels | 65.62, 66.40, 67.18, 67.96, 68.75 |
| Alternative scenario | |
|---|---|
| Recommendation | BUY STOP |
| Entry Point | 68.00 |
| Take Profit | 68.75 |
| Stop Loss | 67.70 |
| Key Levels | 65.62, 66.40, 67.18, 67.96, 68.75 |
Current trend
On Monday, prices fell sharply, and Brent Crude oil is currently trading around 67.50.
Quotes were pressured by a decision of the Chinese authorities to impose import duties on 128 US products, among which frozen pork, wine, some types of fruit and steel factory goods. Investors knew of the potential retaliatory measures, but there was a hope that their introduction would not happen while Washington and Beijing are conducting trade consultations.
In addition, the instrument is pressured by first Russia's failure since the beginning of the OPEC agreement+ to comply with its terms and exceeding the quotas of oil production. According to the Russian Minister of Energy Alexander Novak, this was due to increased production of gas condensate due to cold weather and a traditional increase in production before the spring prophylactic works.
In the evening, the market is waiting for the publication of API data on commercial oil reserves in the US. If they grow again, oil prices will continue to decline.
Support and resistance
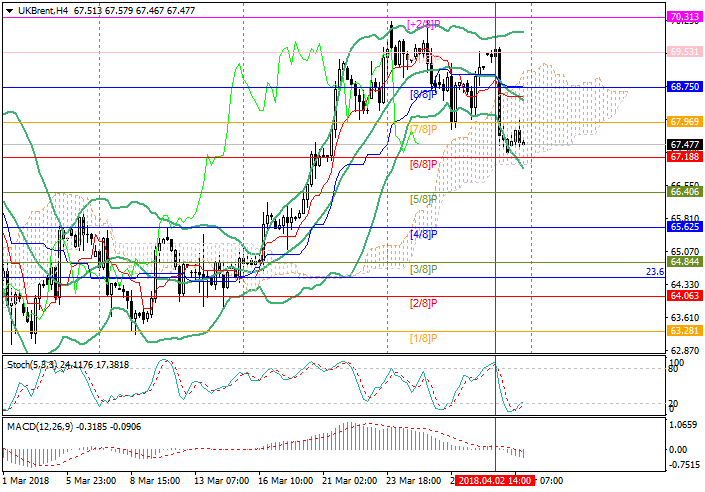
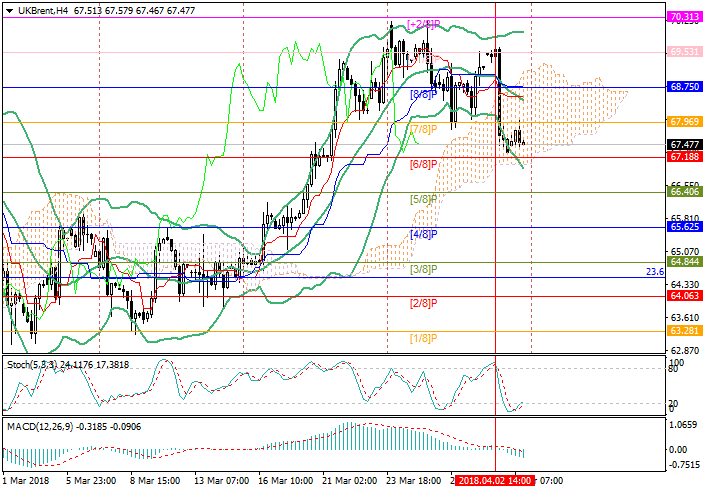
The technical picture is uncertain. Bollinger Bands have turned down, confirming the downward trend. But Stochastic is reversing in the oversold zone, which indicates a possible upward correction. In the breakout of the 67.96 mark (Murray [7/8]), the instrument can be adjusted to the level of 68.75 (Murray [8/8], the midline of Bollinger Bands). In the breakdown of 67.18 mark (Murray [6/8]), the decline will continue to levels of 66.40 (Murray [5/8]) and 65.62 (Murray [4/8]).
Support levels: 67.18, 66.40, 65.62.
Resistance levels: 67.96, 68.75.

Trading tips
Short positions may be opened below the level of 67.18 with targets at 66.40, 65.62 and stop-loss at 67.60.
Long positions may be opened above the level of 67.96 with the target at 68.75 and stop-loss at 67.70.
On Monday, prices fell sharply, and Brent Crude oil is currently trading around 67.50.
Quotes were pressured by a decision of the Chinese authorities to impose import duties on 128 US products, among which frozen pork, wine, some types of fruit and steel factory goods. Investors knew of the potential retaliatory measures, but there was a hope that their introduction would not happen while Washington and Beijing are conducting trade consultations.
In addition, the instrument is pressured by first Russia's failure since the beginning of the OPEC agreement+ to comply with its terms and exceeding the quotas of oil production. According to the Russian Minister of Energy Alexander Novak, this was due to increased production of gas condensate due to cold weather and a traditional increase in production before the spring prophylactic works.
In the evening, the market is waiting for the publication of API data on commercial oil reserves in the US. If they grow again, oil prices will continue to decline.
Support and resistance
The technical picture is uncertain. Bollinger Bands have turned down, confirming the downward trend. But Stochastic is reversing in the oversold zone, which indicates a possible upward correction. In the breakout of the 67.96 mark (Murray [7/8]), the instrument can be adjusted to the level of 68.75 (Murray [8/8], the midline of Bollinger Bands). In the breakdown of 67.18 mark (Murray [6/8]), the decline will continue to levels of 66.40 (Murray [5/8]) and 65.62 (Murray [4/8]).
Support levels: 67.18, 66.40, 65.62.
Resistance levels: 67.96, 68.75.

Trading tips
Short positions may be opened below the level of 67.18 with targets at 66.40, 65.62 and stop-loss at 67.60.
Long positions may be opened above the level of 67.96 with the target at 68.75 and stop-loss at 67.70.


No comments:
Write comments