
AUD/USD: the pair is showing mixed dynamics
06 April 2018, 09:55
| Scenario | |
|---|---|
| Timeframe | Intraday |
| Recommendation | BUY STOP |
| Entry Point | 0.7710, 0.7730 |
| Take Profit | 0.7767, 0.7800 |
| Stop Loss | 0.7680, 0.7670 |
| Key Levels | 0.7600, 0.7638, 0.7667, 0.7705, 0.7725, 0.7742, 0.7767 |
| Alternative scenario | |
|---|---|
| Recommendation | SELL STOP |
| Entry Point | 0.7660, 0.7640 |
| Take Profit | 0.7600 |
| Stop Loss | 0.7700 |
| Key Levels | 0.7600, 0.7638, 0.7667, 0.7705, 0.7725, 0.7742, 0.7767 |
Current trend
AUD declined against USD yesterday, departing from local highs since March 27. The decline of the instrument was taking place against the backdrop of conflicting macroeconomic statistics from the US, while the data from Australia were better than analysts' expectations.
Australia's report on AiG Performance of Services Index was positive: the March figure from AiG increased from 54.0 to 56.9 points. Australian exports and imports in February showed zero dynamics, which led to a slower decline in the trade surplus: from 952M to 825M with a forecast of a decrease to 700M.
As for the US data, traders paid attention to initial jobless claims statistics, which increased significantly from 218K to 242K for the week ending March 30 (225K forecasted).
Today, the focus of traders' attention is the March report on the labor market (14:30 GMT+2), as well as the speech of the Fed's Chairman Jerome Powell at 19:30 (GMT+2).
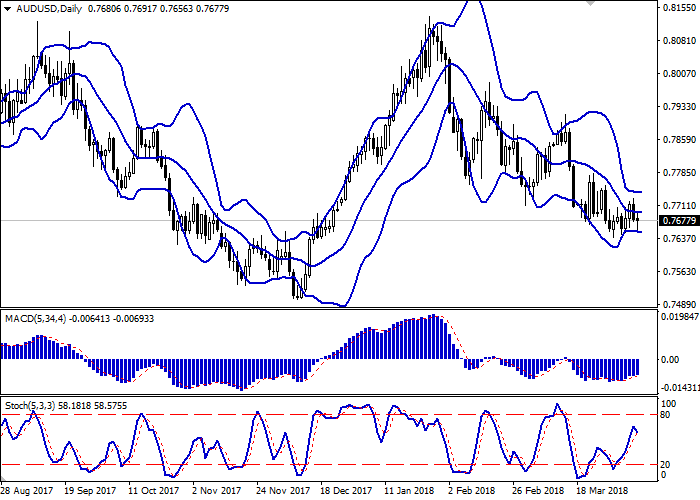
Support and resistance
Bollinger Bands in D1 chart demonstrate flat dynamics. The price range remains practically unchanged.
MACD indicator is growing preserving an unstable buy signal (the histogram is above the signal line).
Stochastic interrupted its growth, reacting to the return of the "bearish" trend yesterday.
The technical indicators remain contradictory, therefore, to open new positions, it is necessary to wait for clarification of the situation.
Resistance levels: 0.7705, 0.7725, 0.7742, 0.7767.
Support levels: 0.7667, 0.7638, 0.7600.
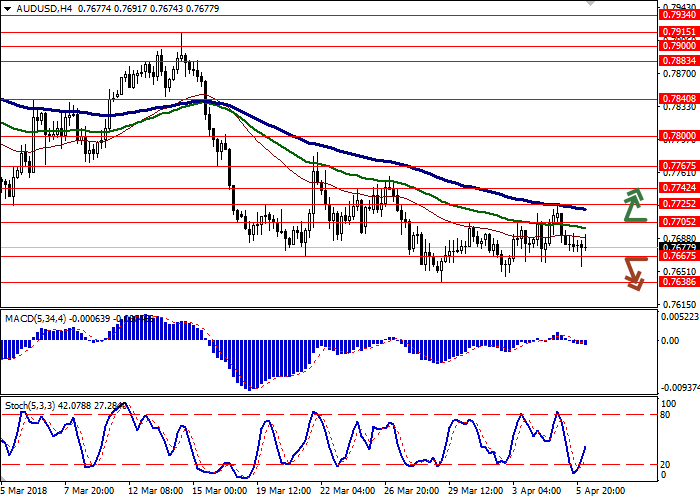
Trading tips
To open long positions one can rely on the breakout of the level of 0.7705 or 0.7725, while maintaining "bullish" signals from technical indicators. Take-profit – 0.7767 or 0.7800. Stop-loss — 0.7680, 0.7670. Implementation period: 2-3 days.
The breakdown of 0.7667–0.7650 mark may serve as a signal to further sales with the target at 0.7600. Stop-loss — 0.7700. Implementation period: 1-2 days.
AUD declined against USD yesterday, departing from local highs since March 27. The decline of the instrument was taking place against the backdrop of conflicting macroeconomic statistics from the US, while the data from Australia were better than analysts' expectations.
Australia's report on AiG Performance of Services Index was positive: the March figure from AiG increased from 54.0 to 56.9 points. Australian exports and imports in February showed zero dynamics, which led to a slower decline in the trade surplus: from 952M to 825M with a forecast of a decrease to 700M.
As for the US data, traders paid attention to initial jobless claims statistics, which increased significantly from 218K to 242K for the week ending March 30 (225K forecasted).
Today, the focus of traders' attention is the March report on the labor market (14:30 GMT+2), as well as the speech of the Fed's Chairman Jerome Powell at 19:30 (GMT+2).
Support and resistance
Bollinger Bands in D1 chart demonstrate flat dynamics. The price range remains practically unchanged.
MACD indicator is growing preserving an unstable buy signal (the histogram is above the signal line).
Stochastic interrupted its growth, reacting to the return of the "bearish" trend yesterday.
The technical indicators remain contradictory, therefore, to open new positions, it is necessary to wait for clarification of the situation.
Resistance levels: 0.7705, 0.7725, 0.7742, 0.7767.
Support levels: 0.7667, 0.7638, 0.7600.
Trading tips
To open long positions one can rely on the breakout of the level of 0.7705 or 0.7725, while maintaining "bullish" signals from technical indicators. Take-profit – 0.7767 or 0.7800. Stop-loss — 0.7680, 0.7670. Implementation period: 2-3 days.
The breakdown of 0.7667–0.7650 mark may serve as a signal to further sales with the target at 0.7600. Stop-loss — 0.7700. Implementation period: 1-2 days.


No comments:
Write comments