
USD/CHF: the dollar is strengthening
06 April 2018, 09:45
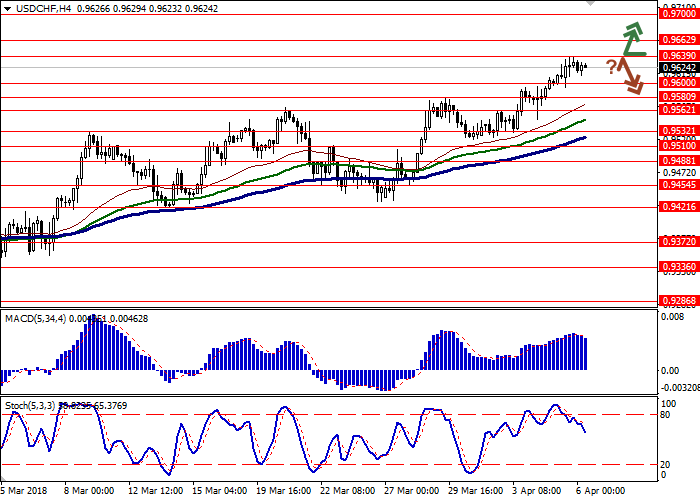
| Scenario | |
|---|---|
| Timeframe | Intraday |
| Recommendation | BUY STOP |
| Entry Point | 0.9645 |
| Take Profit | 0.9700 |
| Stop Loss | 0.9600 |
| Key Levels | 0.9532, 0.9562, 0.9580, 0.9600, 0.9639, 0.9662, 0.9700 |
| Alternative scenario | |
|---|---|
| Recommendation | SELL STOP |
| Entry Point | 0.9590 |
| Take Profit | 0.9532, 0.9500 |
| Stop Loss | 0.9640 |
| Key Levels | 0.9532, 0.9562, 0.9580, 0.9600, 0.9639, 0.9662, 0.9700 |
Current trend
Yesterday USD moderately grew against CHF and renewed the maximum since January 23, despite not so favorable US news background.
The market treated negatively the recent Fed’s representatives’ speeches. The member of regulator’s management Lael Brainard noted that the trade war of China and USA brought risks to US economy, and the head of St. Louis FRB James Bullard stated that if the conflict tightened, Fed would not be able to not fulfill its promise of 2 more interest rate increases this year. On the other hand, the Director of the National Economic Council Larry Kudlow calmed the investors. He noted that despite the countries’ intention to imply trading fees against each other, there was enough time to solve the problem.
March Swiss inflation data supported CHF. Consumer Price Index strengthened by 0.4% MoM and 0.8% YoY, exceeding the analysts’ expectations of +0.2% MoM and +0.7% YoY.
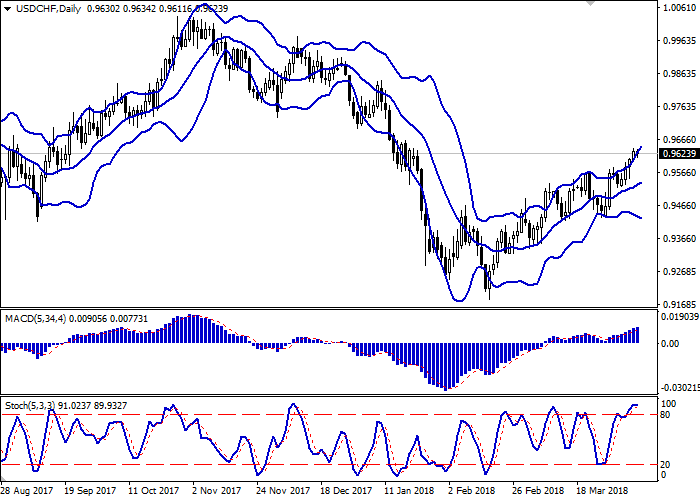
Support and resistance
On the daily chart, Bollinger Bands are moderately growing. The price range is widening, but not as fast as the “bullish” dynamic develops. MACD is growing, keeping a quite steady sell signal (the histogram is above the signal line). Stochastic reached its highs and reversed horizontally.
The current readings of the technical indicators do not contradict with the “bullish” trend development, but the correction is possible in the short term.
Resistance levels: 0.9639, 0.9662, 0.9700.
Support levels: 0.9600, 0.9580, 0.9562, 0.9532.
Trading tips
Long positions can be opened after the breakout of the level 0.9639 upwards with the target at 0.9700 and stop loss 0.9600. Implementation period: 1–2 days.
Short positions can be opened after the rebound at the level of 0.9639 and the breakdown of the level 0.9600 with the targets at 0.9532–0.9500 and stop loss 0.9640. Implementation period: 2–3 days.
Yesterday USD moderately grew against CHF and renewed the maximum since January 23, despite not so favorable US news background.
The market treated negatively the recent Fed’s representatives’ speeches. The member of regulator’s management Lael Brainard noted that the trade war of China and USA brought risks to US economy, and the head of St. Louis FRB James Bullard stated that if the conflict tightened, Fed would not be able to not fulfill its promise of 2 more interest rate increases this year. On the other hand, the Director of the National Economic Council Larry Kudlow calmed the investors. He noted that despite the countries’ intention to imply trading fees against each other, there was enough time to solve the problem.
March Swiss inflation data supported CHF. Consumer Price Index strengthened by 0.4% MoM and 0.8% YoY, exceeding the analysts’ expectations of +0.2% MoM and +0.7% YoY.
Support and resistance
On the daily chart, Bollinger Bands are moderately growing. The price range is widening, but not as fast as the “bullish” dynamic develops. MACD is growing, keeping a quite steady sell signal (the histogram is above the signal line). Stochastic reached its highs and reversed horizontally.
The current readings of the technical indicators do not contradict with the “bullish” trend development, but the correction is possible in the short term.
Resistance levels: 0.9639, 0.9662, 0.9700.
Support levels: 0.9600, 0.9580, 0.9562, 0.9532.
Trading tips
Long positions can be opened after the breakout of the level 0.9639 upwards with the target at 0.9700 and stop loss 0.9600. Implementation period: 1–2 days.
Short positions can be opened after the rebound at the level of 0.9639 and the breakdown of the level 0.9600 with the targets at 0.9532–0.9500 and stop loss 0.9640. Implementation period: 2–3 days.


No comments:
Write comments