
EUR/USD: the pair is trading in both directions
09 April 2018, 09:33
| Scenario | |
|---|---|
| Timeframe | Intraday |
| Recommendation | BUY STOP |
| Entry Point | 1.2295 |
| Take Profit | 1.2343, 1.2360 |
| Stop Loss | 1.2260 |
| Key Levels | 1.2212, 1.2235, 1.2257, 1.2289, 1.2312, 1.2343, 1.2382 |
| Alternative scenario | |
|---|---|
| Recommendation | SELL STOP |
| Entry Point | 1.2250 |
| Take Profit | 1.2212, 1.2200 |
| Stop Loss | 1.2280, 1.2290 |
| Key Levels | 1.2212, 1.2235, 1.2257, 1.2289, 1.2312, 1.2343, 1.2382 |
Current trend
EUR starts a new week cautiously, continuing to play out the impulses of last week and expecting the appearance of new drivers. One such impulse is the March report on the US labor market, released on April 6.
This report as a whole was not satisfactory. The number of nonfarm payrolls was less than forecasted. The indicator amounted 103K instead of 193K. The unemployment rate remained at around 4.1% instead of decline. But the average hourly wage increased from 2.6% to 2.7% YoY and grew from 0.1% to 0.3% MoM.
Published on Friday, February data on industrial production in Germany were significantly worse than expected. On an annual basis, the indicator grew by 2.6%, not reaching the forecast of 4.3%. And on a monthly basis, the volume of industrial production decreased by 1.6% instead of growth.
Support and resistance
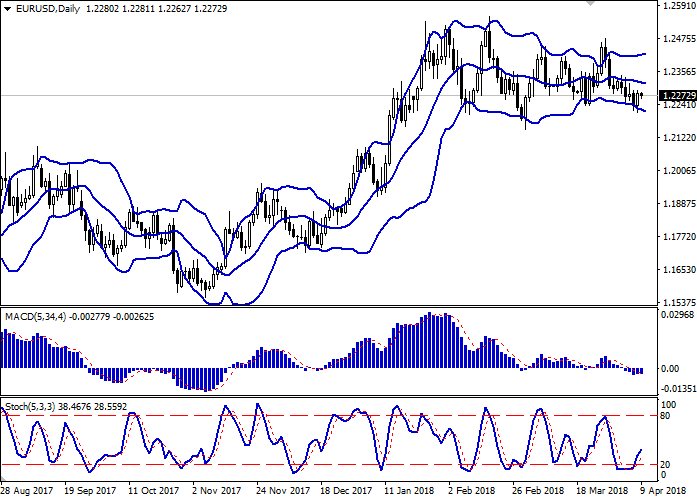
Bollinger Bands in D1 chart demonstrate flat dynamics. The price range is slightly expanded, while remaining spacious enough for the current activity level in the market.
MACD indicator is gradually reversing upwards trying to form a buy signal (the histogram has to consolidate above the signal line).
Stochastic shows more confident growth, signaling in favor of development of corrective dynamics.
Consider development of correctional growth in the short term.
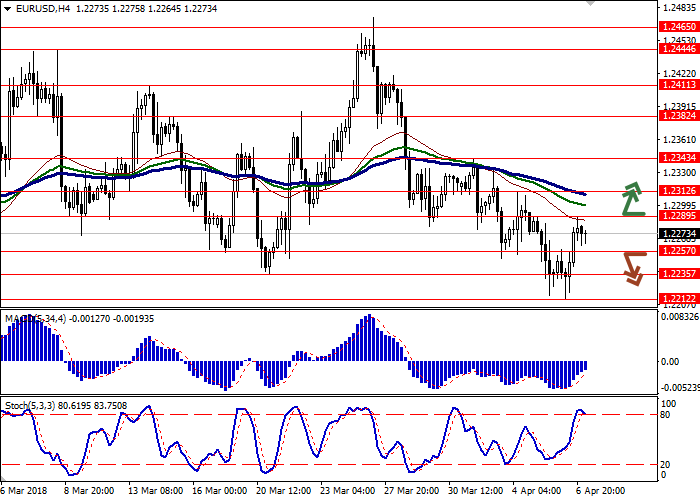
Resistance levels: 1.2289, 1.2312, 1.2343, 1.2382.
Support levels: 1.2257, 1.2235, 1.2212.
Trading tips
To open long positions one can rely on the breakout of the level of 1.2289, while maintaining "bullish" signals from technical indicators. Take-profit – 1.2343–1.2360. Stop-loss – 1.2260. Implementation period: 2-3 days.
The return of "bearish" trend with the breakdown of the level of 1.2257 may become a signal for the return to the sales with targets at 1.2212–1.2200. Stop-loss – 1.2280–1.2290. Implementation period: 2-3 days.
EUR starts a new week cautiously, continuing to play out the impulses of last week and expecting the appearance of new drivers. One such impulse is the March report on the US labor market, released on April 6.
This report as a whole was not satisfactory. The number of nonfarm payrolls was less than forecasted. The indicator amounted 103K instead of 193K. The unemployment rate remained at around 4.1% instead of decline. But the average hourly wage increased from 2.6% to 2.7% YoY and grew from 0.1% to 0.3% MoM.
Published on Friday, February data on industrial production in Germany were significantly worse than expected. On an annual basis, the indicator grew by 2.6%, not reaching the forecast of 4.3%. And on a monthly basis, the volume of industrial production decreased by 1.6% instead of growth.
Support and resistance
Bollinger Bands in D1 chart demonstrate flat dynamics. The price range is slightly expanded, while remaining spacious enough for the current activity level in the market.
MACD indicator is gradually reversing upwards trying to form a buy signal (the histogram has to consolidate above the signal line).
Stochastic shows more confident growth, signaling in favor of development of corrective dynamics.
Consider development of correctional growth in the short term.
Resistance levels: 1.2289, 1.2312, 1.2343, 1.2382.
Support levels: 1.2257, 1.2235, 1.2212.
Trading tips
To open long positions one can rely on the breakout of the level of 1.2289, while maintaining "bullish" signals from technical indicators. Take-profit – 1.2343–1.2360. Stop-loss – 1.2260. Implementation period: 2-3 days.
The return of "bearish" trend with the breakdown of the level of 1.2257 may become a signal for the return to the sales with targets at 1.2212–1.2200. Stop-loss – 1.2280–1.2290. Implementation period: 2-3 days.


No comments:
Write comments