
XAG/USD: silver is trading mixed
28 March 2018, 10:02
| Scenario | |
|---|---|
| Timeframe | Intraday |
| Recommendation | BUY STOP |
| Entry Point | 16.55 |
| Take Profit | 16.65, 16.70 |
| Stop Loss | 16.45, 16.40 |
| Key Levels | 16.14, 16.20, 16.25, 16.34, 16.51, 16.60, 16.71, 16.77 |
| Alternative scenario | |
|---|---|
| Recommendation | SELL STOP |
| Entry Point | 16.30 |
| Take Profit | 16.20, 16.14 |
| Stop Loss | 16.40, 16.45 |
| Key Levels | 16.14, 16.20, 16.25, 16.34, 16.51, 16.60, 16.71, 16.77 |
Current trend
Yesterday silver prices significantly went down and stepped off the highs since March 7 due to the increase in the investors’ interest in risk currencies and moderate growth of USD, as the tightening upon USA trade relations is falling. However, the traders are still concerned upon geopolitical problems, which supports raw materials demand. In particular, the investors are focused on the diplomatic crisis between Russia and the West.
Today American data are worth traders’ attention. The market is focused on Q4, 2017, GDP Annualized release and Personal Consumption Expenditures publications. FOMC Member Bostic speech at 18:00 (GMT+2) can affect the instrument, too.
Support and resistance
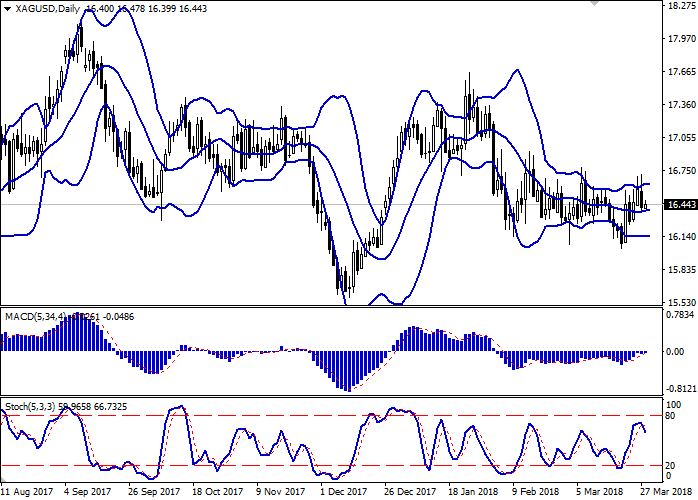
On the daily chart, Bollinger Bands are trading flat. The price range consolidated but is still too wide for the current activity level.
MACD is growing, keeping a weak buy signal (the histogram is above the signal line). The readings of the indicator do not correlate with the actual dynamics, so it is better to wait until the situation is clear.
Stochastic reversed downwards, reacting to yesterday’s “bearish” moods. The correctional decrease development is possible in the short or very short term.
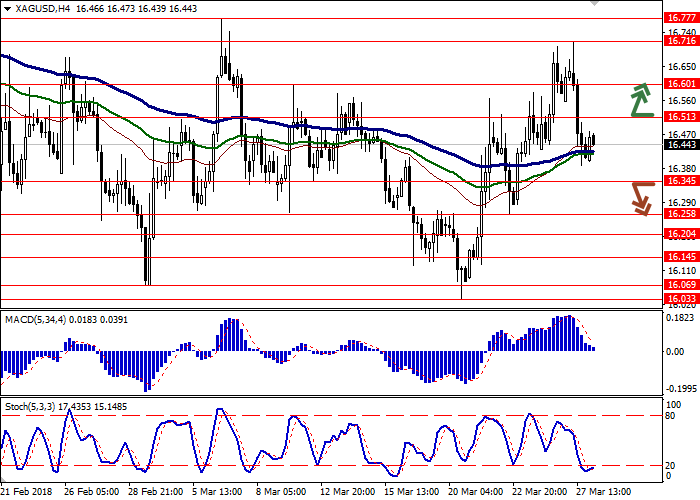
Resistance levels: 16.51, 16.60, 16.71, 16.77.
Support levels: 16.34, 16.25, 16.20, 16.14.
Trading tips
Long positions can be opened after the breakout of the level 16.51 with the targets at 16.65 or 16.70 and stop loss 16.45–16.40. Implementation period: 2–3 days.
Short positions can be opened after the breakdown of the level 16.34 with the targets at 16.20–16.14 and stop loss 16.40–16.45. Implementation period: 2–3 days.
Yesterday silver prices significantly went down and stepped off the highs since March 7 due to the increase in the investors’ interest in risk currencies and moderate growth of USD, as the tightening upon USA trade relations is falling. However, the traders are still concerned upon geopolitical problems, which supports raw materials demand. In particular, the investors are focused on the diplomatic crisis between Russia and the West.
Today American data are worth traders’ attention. The market is focused on Q4, 2017, GDP Annualized release and Personal Consumption Expenditures publications. FOMC Member Bostic speech at 18:00 (GMT+2) can affect the instrument, too.
Support and resistance
On the daily chart, Bollinger Bands are trading flat. The price range consolidated but is still too wide for the current activity level.
MACD is growing, keeping a weak buy signal (the histogram is above the signal line). The readings of the indicator do not correlate with the actual dynamics, so it is better to wait until the situation is clear.
Stochastic reversed downwards, reacting to yesterday’s “bearish” moods. The correctional decrease development is possible in the short or very short term.
Resistance levels: 16.51, 16.60, 16.71, 16.77.
Support levels: 16.34, 16.25, 16.20, 16.14.
Trading tips
Long positions can be opened after the breakout of the level 16.51 with the targets at 16.65 or 16.70 and stop loss 16.45–16.40. Implementation period: 2–3 days.
Short positions can be opened after the breakdown of the level 16.34 with the targets at 16.20–16.14 and stop loss 16.40–16.45. Implementation period: 2–3 days.


No comments:
Write comments