
USD/CAD: US dollar remains under pressure
28 March 2018, 10:02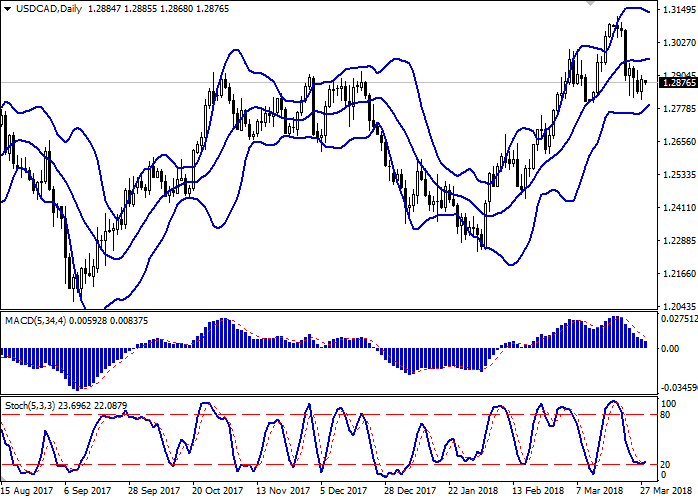
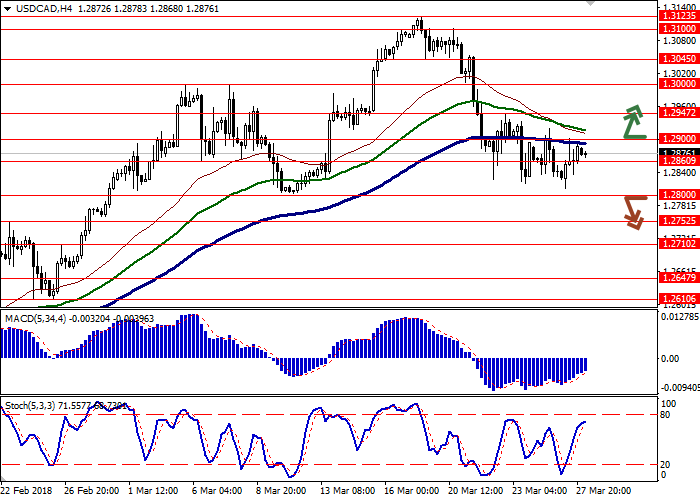
| Scenario | |
|---|---|
| Timeframe | Intraday |
| Recommendation | BUY STOP |
| Entry Point | 1.2910 |
| Take Profit | 1.3000 |
| Stop Loss | 1.2860, 1.2850 |
| Key Levels | 1.2710, 1.2752, 1.2800, 1.2860, 1.2900, 1.2947, 1.3000, 1.3045 |
| Alternative scenario | |
|---|---|
| Recommendation | SELL STOP |
| Entry Point | 1.2790 |
| Take Profit | 1.2710, 1.2700 |
| Stop Loss | 1.2850 |
| Key Levels | 1.2710, 1.2752, 1.2800, 1.2860, 1.2900, 1.2947, 1.3000, 1.3045 |
Current trend
USD showed a corrective growth against CAD on Tuesday, offsetting the decline at the beginning of the current trading week. However, today the instrument is again inclined to decrease.
Investors expect publication of annual data on US GDP for Q4 2017 (14:30 GMT+2). Accelerating of the US economy growth can provide USD with short-term support, but it is too early to expect correction.
Moderate support for USD is given by a possible improvement in US and China trade relations: the countries intend to start trade negotiations.
Support and resistance
Bollinger Bands in D1 chart demonstrate flat dynamics. The price range is narrowing, reflecting the mixed nature of trading in the short term. Until the clarification of the situation, the channel trading strategy should be followed.
MACD is going down preserving a stable sell signal (histogram being located below the signal line). There is an opportunity to maintain existing short positions in the short term, whereas it is better to refuse from the opening of new purchases.
Stochastic is turning upwards near the "20" mark, which can be called a formal border of oversold USD. One should take into account the risks of a corrective growth in the short and/or ultra-short term.
Resistance levels: 1.2900, 1.2947, 1.3000, 1.3045.
Support levels: 1.2860, 1.2800, 1.2752, 1.2710.

Trading tips
To open long positions one can rely on the breakout of the level of 1.2900, while maintaining "bullish" signals from technical indicators. Take-profit – 1.3000. Stop-loss — 1.2860–1.2850. Implementation period: 2-3 days.
The return of the "bearish" trend with a breakdown of the level of 1.2800 may be an alternative. In this case, the targets of the "bears" may be located around the level of 1.2710–1.2700. Stop-loss – 1.2850. Implementation period: 2-3 days.
USD showed a corrective growth against CAD on Tuesday, offsetting the decline at the beginning of the current trading week. However, today the instrument is again inclined to decrease.
Investors expect publication of annual data on US GDP for Q4 2017 (14:30 GMT+2). Accelerating of the US economy growth can provide USD with short-term support, but it is too early to expect correction.
Moderate support for USD is given by a possible improvement in US and China trade relations: the countries intend to start trade negotiations.
Support and resistance
Bollinger Bands in D1 chart demonstrate flat dynamics. The price range is narrowing, reflecting the mixed nature of trading in the short term. Until the clarification of the situation, the channel trading strategy should be followed.
MACD is going down preserving a stable sell signal (histogram being located below the signal line). There is an opportunity to maintain existing short positions in the short term, whereas it is better to refuse from the opening of new purchases.
Stochastic is turning upwards near the "20" mark, which can be called a formal border of oversold USD. One should take into account the risks of a corrective growth in the short and/or ultra-short term.
Resistance levels: 1.2900, 1.2947, 1.3000, 1.3045.
Support levels: 1.2860, 1.2800, 1.2752, 1.2710.
Trading tips
To open long positions one can rely on the breakout of the level of 1.2900, while maintaining "bullish" signals from technical indicators. Take-profit – 1.3000. Stop-loss — 1.2860–1.2850. Implementation period: 2-3 days.
The return of the "bearish" trend with a breakdown of the level of 1.2800 may be an alternative. In this case, the targets of the "bears" may be located around the level of 1.2710–1.2700. Stop-loss – 1.2850. Implementation period: 2-3 days.


No comments:
Write comments