
USD/JPY: the dollar is correcting
28 March 2018, 09:31
| Scenario | |
|---|---|
| Timeframe | Intraday |
| Recommendation | BUY STOP |
| Entry Point | 105.95 |
| Take Profit | 106.44, 106.71 |
| Stop Loss | 105.50 |
| Key Levels | 104.56, 105.00, 105.23, 105.88, 106.15, 106.44, 106.71 |
| Alternative scenario | |
|---|---|
| Recommendation | SELL STOP |
| Entry Point | 105.15, 104.90 |
| Take Profit | 104.56, 104.25, 104.00 |
| Stop Loss | 105.50, 105.60 |
| Key Levels | 104.56, 105.00, 105.23, 105.88, 106.15, 106.44, 106.71 |
Current trend
USD showed mixed dynamics of trading against the Japanese yen on Tuesday, but returned to growth today. Support for USD was given by the loosened tension around the prospects for new trade wars, after the US announced its readiness to hold talks with China on import duties.
Today, investors will focus on the US GDP for Q4 2017 (14:30 GMT+2). Analysts expect the US economy to accelerate from +2.5% YoY to +2.7% YoY. Traders will pay attention to the dynamics of Personal Consumption Expenditures Prices (14:30 GMT+2) and the statistics on Pending Home Sales for February (16:00 GMT+2).
Support and resistance
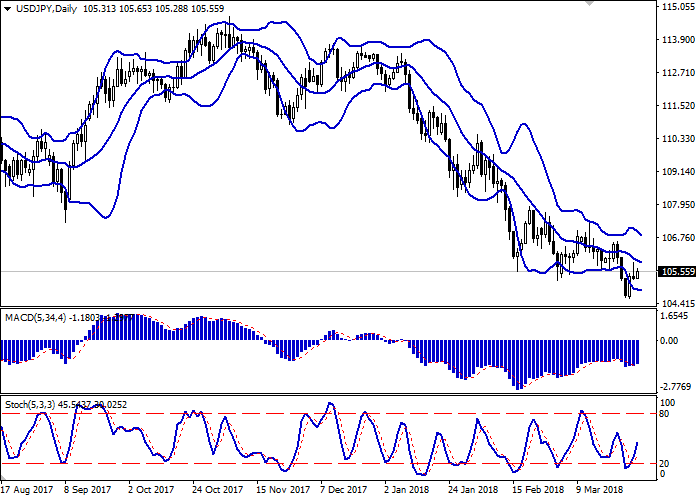
On the D1 chart Bollinger Bands demonstrate a tendency to turn in a horizontal plane. The price range is narrowing from above, reflecting the mixed dynamics of trading in the short term. Until the clarification of the situation, the channel trading strategy should be followed.
MACD indicator is growing preserving a stable buy signal (the histogram is above the signal line). There is an opportunity for planning new long positions in the short and/or ultra-short term.
Stochastic is showing similar dynamics and is located in the middle of its area. The current showings of the indicator do not contradict the further development of the "bullish" trend.
Resistance levels: 105.88, 106.15, 106.44, 106.71.
Support levels: 105.23, 105.00, 104.56.
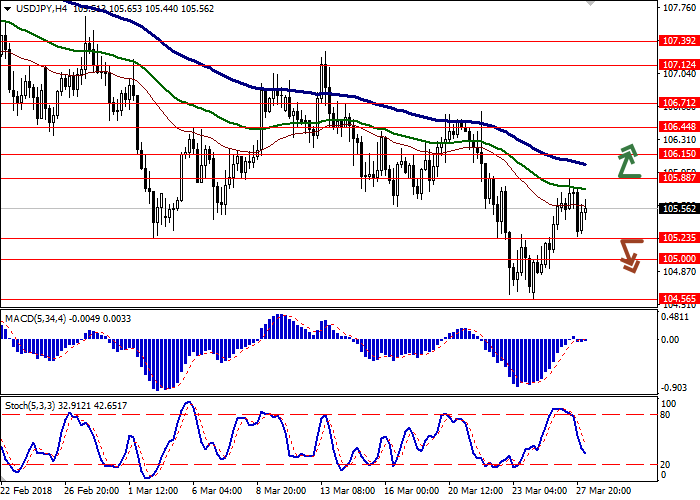
Trading tips
To open long positions, one can rely on the breakout of 105.88 mark, provided that the showings of technical indicators do not contradict the development of the "bullish" trend. Take-profit — 106.44 or 106.71. Stop-loss — 105.50. Implementation period: 2-3 days.
The return of "bearish" trend with the breakdown of the level of 105.23–105.00 may become a signal for new sales with the targets at 104.56 or 104.25–104.00. Stop-loss — 105.50–105.60. Implementation period: 2-3 days.
USD showed mixed dynamics of trading against the Japanese yen on Tuesday, but returned to growth today. Support for USD was given by the loosened tension around the prospects for new trade wars, after the US announced its readiness to hold talks with China on import duties.
Today, investors will focus on the US GDP for Q4 2017 (14:30 GMT+2). Analysts expect the US economy to accelerate from +2.5% YoY to +2.7% YoY. Traders will pay attention to the dynamics of Personal Consumption Expenditures Prices (14:30 GMT+2) and the statistics on Pending Home Sales for February (16:00 GMT+2).
Support and resistance
On the D1 chart Bollinger Bands demonstrate a tendency to turn in a horizontal plane. The price range is narrowing from above, reflecting the mixed dynamics of trading in the short term. Until the clarification of the situation, the channel trading strategy should be followed.
MACD indicator is growing preserving a stable buy signal (the histogram is above the signal line). There is an opportunity for planning new long positions in the short and/or ultra-short term.
Stochastic is showing similar dynamics and is located in the middle of its area. The current showings of the indicator do not contradict the further development of the "bullish" trend.
Resistance levels: 105.88, 106.15, 106.44, 106.71.
Support levels: 105.23, 105.00, 104.56.
Trading tips
To open long positions, one can rely on the breakout of 105.88 mark, provided that the showings of technical indicators do not contradict the development of the "bullish" trend. Take-profit — 106.44 or 106.71. Stop-loss — 105.50. Implementation period: 2-3 days.
The return of "bearish" trend with the breakdown of the level of 105.23–105.00 may become a signal for new sales with the targets at 104.56 or 104.25–104.00. Stop-loss — 105.50–105.60. Implementation period: 2-3 days.


No comments:
Write comments