XAU/USD: gold price is going down
14 September 2017, 10:03
| Scenario | |
|---|---|
| Timeframe | Intraday |
| Recommendation | BUY |
| Entry Point | 1323.71 |
| Take Profit | 1334.32, 1343.98 |
| Stop Loss | 1312.00 |
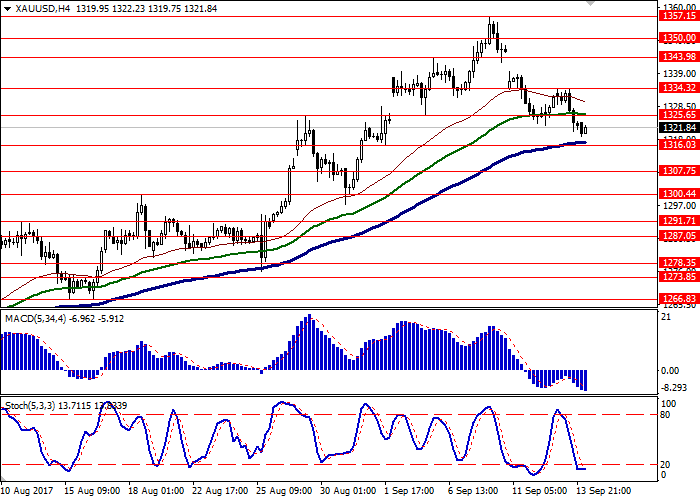
| Key Levels | 1291.71, 1300.44, 1307.75, 1316.03, 1325.65, 1334.32, 1343.98, 1350.00, 1357.15 |
| Alternative scenario | |
|---|---|
| Recommendation | SELL STOP |
| Entry Point | 1315.00 |
| Take Profit | 1300.00 |
| Stop Loss | 1328.50 |
| Key Levels | 1291.71, 1300.44, 1307.75, 1316.03, 1325.65, 1334.32, 1343.98, 1350.00, 1357.15 |
Current trend
During the trading session on Wednesday, September, 13, gold prices significantly went down and renewed the lows since the beginning of the month due to the preliminary information that Trumps’ Administration is ready to make public the awaited tax reform. According to unconfirmed reports, the details of the new plan can be disclosed next week.
During the morning session in September, 14, the “bearish” moods prevail. The instrument is pressed by the poor Chinese macroeconomical statistics: Industrial Production in China slowed from +6.4% YoY to +6.0% YoY in August, while the analysts expected the fastening to +6.6% YoY. The growth of Retail Sales fell from +10.4% YoY to +10.1% YoY, which is also worse than expected value of +10.5% YoY.
On Thursday the investors are waiting for the August consumer inflation data in the USA. The traders hope that the statistics will clear the perspectives of further monetary policy tightening.
Support and resistance
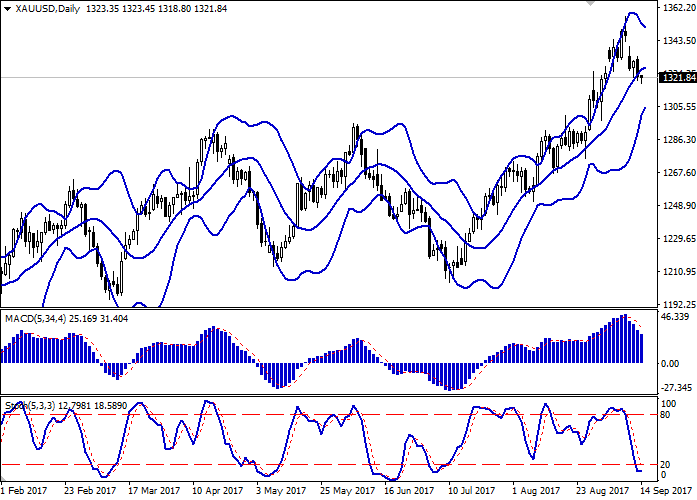
On the daily chart Bollinger Bands are reversing into flat. The price range is actively narrowing, reflecting the change of the trend in the short term. It’s better to use channel trading strategy.
MACD is going down, keeping strong sell signal (the histogram is below the signal line). It’s better to keep current short positions, but wait to the clear signals to appear before opening new ones.
Stochastic has reached the limit in the oversold area and reversed into flat. The readings of the indicators reflect the correctional growth appearance in the end of the week. It’s better to close profitable short positions.
Resistance levels: 1325.65, 1334.32, 1343.98, 1350.00, 1357.15.
Support levels: 1316.03, 1307.75, 1300.44, 1291.71.


Trading tips
Long positions can be opened after the reversal around 1316.03. Take profit is 1334.32 or 1343.98. Stop loss is 1312.00. Implementation period: 2-3 days.
Steady breakdown 1316.03 can be a signal to open short positions with the target around 1300.00. Stop loss is 1328.50. Implementation period: 2-3 days.
During the trading session on Wednesday, September, 13, gold prices significantly went down and renewed the lows since the beginning of the month due to the preliminary information that Trumps’ Administration is ready to make public the awaited tax reform. According to unconfirmed reports, the details of the new plan can be disclosed next week.
During the morning session in September, 14, the “bearish” moods prevail. The instrument is pressed by the poor Chinese macroeconomical statistics: Industrial Production in China slowed from +6.4% YoY to +6.0% YoY in August, while the analysts expected the fastening to +6.6% YoY. The growth of Retail Sales fell from +10.4% YoY to +10.1% YoY, which is also worse than expected value of +10.5% YoY.
On Thursday the investors are waiting for the August consumer inflation data in the USA. The traders hope that the statistics will clear the perspectives of further monetary policy tightening.
Support and resistance
On the daily chart Bollinger Bands are reversing into flat. The price range is actively narrowing, reflecting the change of the trend in the short term. It’s better to use channel trading strategy.
MACD is going down, keeping strong sell signal (the histogram is below the signal line). It’s better to keep current short positions, but wait to the clear signals to appear before opening new ones.
Stochastic has reached the limit in the oversold area and reversed into flat. The readings of the indicators reflect the correctional growth appearance in the end of the week. It’s better to close profitable short positions.
Resistance levels: 1325.65, 1334.32, 1343.98, 1350.00, 1357.15.
Support levels: 1316.03, 1307.75, 1300.44, 1291.71.


Trading tips
Long positions can be opened after the reversal around 1316.03. Take profit is 1334.32 or 1343.98. Stop loss is 1312.00. Implementation period: 2-3 days.
Steady breakdown 1316.03 can be a signal to open short positions with the target around 1300.00. Stop loss is 1328.50. Implementation period: 2-3 days.


No comments:
Write comments