USD/CAD: the pair is showing flat dynamics
14 September 2017, 10:26
| Scenario | |
|---|---|
| Timeframe | Intraday |
| Recommendation | BUY STOP |
| Entry Point | 1.2230 |
| Take Profit | 1.2360, 1.2380 |
| Stop Loss | 1.2120 |
| Key Levels | 1.2000, 1.2060, 1.2129, 1.2218, 1.2300, 1.2360, 1.2412, 1.2439 |
| Alternative scenario | |
|---|---|
| Recommendation | SELL LIMIT |
| Entry Point | 1.2218 |
| Take Profit | 1.2000 |
| Stop Loss | 1.2300 |
| Key Levels | 1.2000, 1.2060, 1.2129, 1.2218, 1.2300, 1.2360, 1.2412, 1.2439 |
Current trend
US dollar ended the trading on Wednesday, September 13, against the Canadian currency with mixed results. During the trading session the pair managed to update local maximums since September 7, but as a result the "bears" proved to be stronger despite successful corrective dynamics of the US currency in the market.
Wednesday macroeconomic data from the USA had uncertain influence on USD. Thus, manufacturers price index in August grew by 0.2% MoM which was better than the reduction by 0.1% in July. However, the indicator was worse than expected (+0.3% MoM).
On Thursday, September 14, investors will focus their attention on the US statistics on consumer inflation at 14:30 (GMT+2). At the same time, the data on the housing prices in the initial market in July will be released in Canada.
Support and resistance
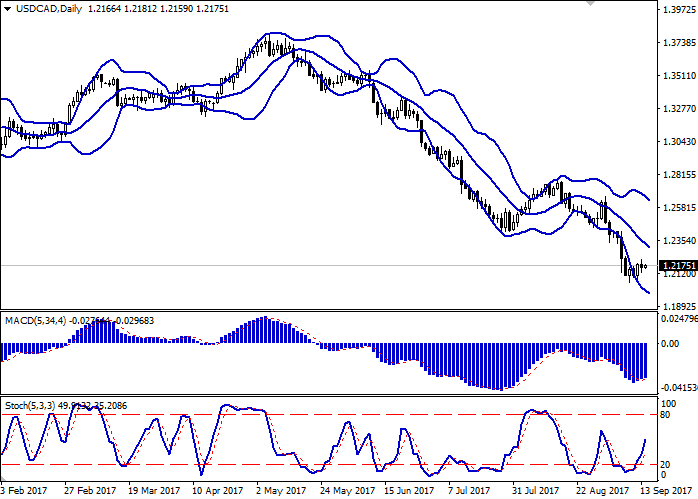
Bollinger Bands on D1 chart demonstrate stable decrease. The price range practically does not change its borders.
MACD indicator is growing preserving a weak buy signal (the histogram is above the signal line). Stochastic is showing more stable dynamics and is located in the middle of its area.
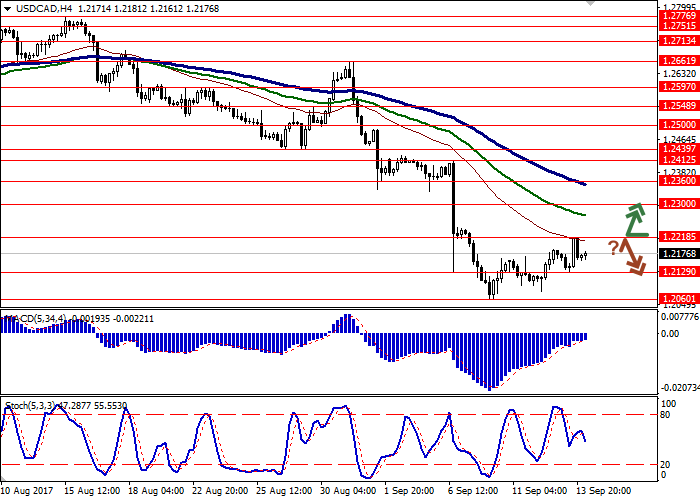
Resistance levels: 1.2218, 1.2300, 1.2360, 1.2412, 1.2439.
Support levels: 1.2129, 1.2060, 1.2000.


Trading tips
Long positions may be opened after the breakthrough of the level of 1.2218 with targets at 1.2360, 1.2380 and stop-loss at 1.2120. The period of implementation is 2-3 days.
Short positions may be opened after a decrease from the level of 1.2218 with target at 1.2000 and stop-loss at 1.2300. The period of implementation is 2-3 days.
US dollar ended the trading on Wednesday, September 13, against the Canadian currency with mixed results. During the trading session the pair managed to update local maximums since September 7, but as a result the "bears" proved to be stronger despite successful corrective dynamics of the US currency in the market.
Wednesday macroeconomic data from the USA had uncertain influence on USD. Thus, manufacturers price index in August grew by 0.2% MoM which was better than the reduction by 0.1% in July. However, the indicator was worse than expected (+0.3% MoM).
On Thursday, September 14, investors will focus their attention on the US statistics on consumer inflation at 14:30 (GMT+2). At the same time, the data on the housing prices in the initial market in July will be released in Canada.
Support and resistance
Bollinger Bands on D1 chart demonstrate stable decrease. The price range practically does not change its borders.
MACD indicator is growing preserving a weak buy signal (the histogram is above the signal line). Stochastic is showing more stable dynamics and is located in the middle of its area.
Resistance levels: 1.2218, 1.2300, 1.2360, 1.2412, 1.2439.
Support levels: 1.2129, 1.2060, 1.2000.


Trading tips
Long positions may be opened after the breakthrough of the level of 1.2218 with targets at 1.2360, 1.2380 and stop-loss at 1.2120. The period of implementation is 2-3 days.
Short positions may be opened after a decrease from the level of 1.2218 with target at 1.2000 and stop-loss at 1.2300. The period of implementation is 2-3 days.


No comments:
Write comments