WTI Crude Oil: general analysis
14 September 2017, 11:05
| Scenario | |
|---|---|
| Timeframe | Intraday |
| Recommendation | BUY STOP |
| Entry Point | 50.05 |
| Take Profit | 50.70, 51.25 |
| Stop Loss | 49.40 |
| Key Levels | 46.25, 47.20, 48.25, 48.80, 54.40, 55.35, 56.30 |
| Alternative scenario | |
|---|---|
| Recommendation | SELL STOP |
| Entry Point | 48.70 |
| Take Profit | 48.00, 47.25 |
| Stop Loss | 49.15 |
| Key Levels | 46.25, 47.20, 48.25, 48.80, 54.40, 55.35, 56.30 |
Current trend
This week oil prices grew due to the OPEC report upon the decrease of the production volumes to 32.755 million barrel per day in August, which is by 80K barrel per day lesser than in July. In addition, yesterday the IEA predicted the growth of global demand on oil by 100K barrel per day in 2017, which has also supported the trade instrument. However, the import of raw oil in the USA has significantly decreased, as huge volumes of the material could not get into the Mexican gulf due to the hurricane, and the Caribbean basin terminal are damaged and will not be working for a few weeks.
There is no key macroeconomic release to be published today, which can significantly affect the trade instrument dynamics, and the further growth of the pair is most possible. Tomorrow the traders should pay attention to the Baker Hughes US Oil Rig Count publication.
Support and resistance
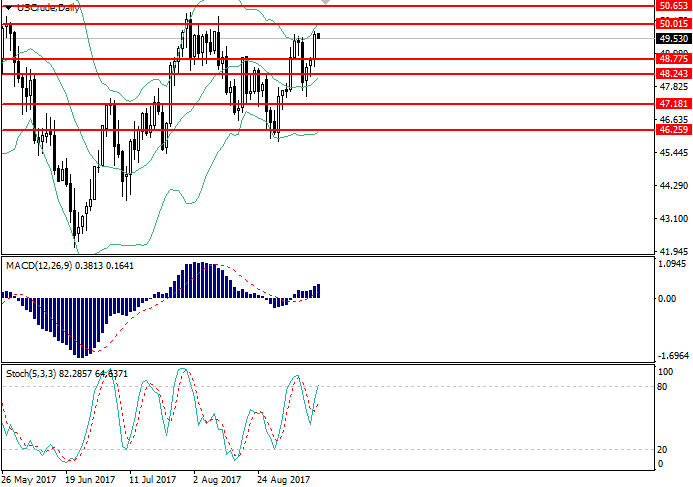
On the daily chart the instrument is trading near the upper border of the Bollinger bands. The indicator is reversing upwards, as the price range is widening, reflecting the development of the current trend. MACD is in the positive zone, keeping strong buy signal. Stochastic is ready to enter the overbought area.
Resistance levels: 54.40, 55.35, 56.30.
Support levels: 48.80, 48.25, 47.20, 46.25.

Trading tips
Long positions can be opened at the level of 50.05 with the targets at 50.70, 51.25 and stop loss at 49.40. Implementation period: 1-3 days.
Short positions can be opened at the level of 48.70 with the targets at 48.00, 47.25 and stop loss at the level of 49.15. Implementation period: 1-3 days.
This week oil prices grew due to the OPEC report upon the decrease of the production volumes to 32.755 million barrel per day in August, which is by 80K barrel per day lesser than in July. In addition, yesterday the IEA predicted the growth of global demand on oil by 100K barrel per day in 2017, which has also supported the trade instrument. However, the import of raw oil in the USA has significantly decreased, as huge volumes of the material could not get into the Mexican gulf due to the hurricane, and the Caribbean basin terminal are damaged and will not be working for a few weeks.
There is no key macroeconomic release to be published today, which can significantly affect the trade instrument dynamics, and the further growth of the pair is most possible. Tomorrow the traders should pay attention to the Baker Hughes US Oil Rig Count publication.
Support and resistance
On the daily chart the instrument is trading near the upper border of the Bollinger bands. The indicator is reversing upwards, as the price range is widening, reflecting the development of the current trend. MACD is in the positive zone, keeping strong buy signal. Stochastic is ready to enter the overbought area.
Resistance levels: 54.40, 55.35, 56.30.
Support levels: 48.80, 48.25, 47.20, 46.25.

Trading tips
Long positions can be opened at the level of 50.05 with the targets at 50.70, 51.25 and stop loss at 49.40. Implementation period: 1-3 days.
Short positions can be opened at the level of 48.70 with the targets at 48.00, 47.25 and stop loss at the level of 49.15. Implementation period: 1-3 days.


No comments:
Write comments