USD/JPY: dollar is trading with growth
14 September 2017, 09:27
| Scenario | |
|---|---|
| Timeframe | Intraday |
| Recommendation | BUY STOP |
| Entry Point | 110.80 |
| Take Profit | 111.50, 111.75 |
| Stop Loss | 110.50, 110.20 |
| Key Levels | 109.11, 109.41, 109.82, 110.23, 110.71, 111.00, 111.27 |
| Alternative scenario | |
|---|---|
| Recommendation | SELL STOP |
| Entry Point | 110.20 |
| Take Profit | 109.40, 109.10 |
| Stop Loss | 111.00 |
| Key Levels | 109.11, 109.41, 109.82, 110.23, 110.71, 111.00, 111.27 |
Current trend
US dollar grew against Japanese yen as a result of trading on Wednesday, September 13, continuing the development of upward dynamics that started on Monday. Within 3 trading days the instrument managed to regain the positions lost last week and to marked a new local maximum since August 31.
Apart from technical factors, the instrument was supported by statement of Trump administration that the program of tax reforms may be presented next week.
On Thursday traders will focus their attention on consumer inflation statistics from the USA for August. The report is due at 14:30 (GMT+2).
Support and resistance
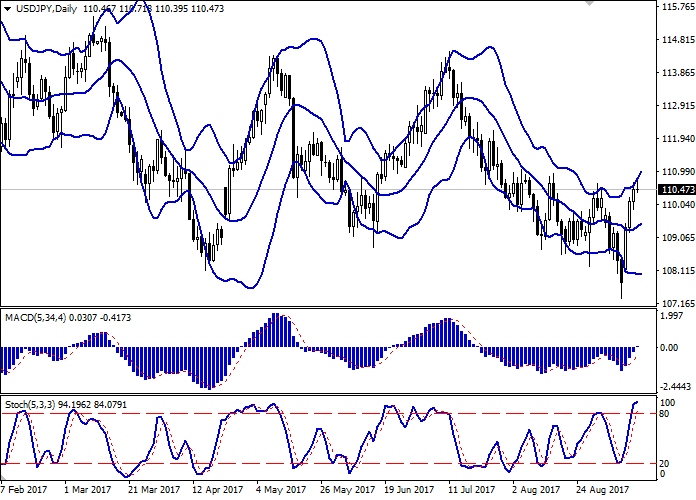
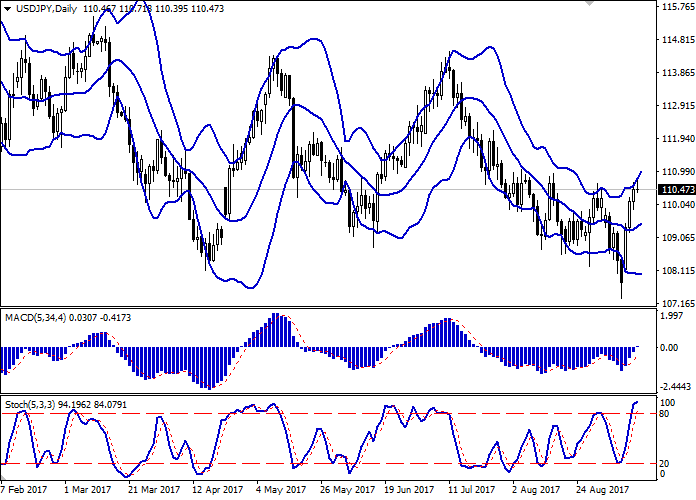
Bollinger Bands in D1 chart demonstrate moderate increase. The price range is narrowing from above. MACD indicator is growing preserving a stable buy signal (the histogram is above the signal line). Stochastic has reached maximum levels in the overbought zone and is trying to reverse horizontally.
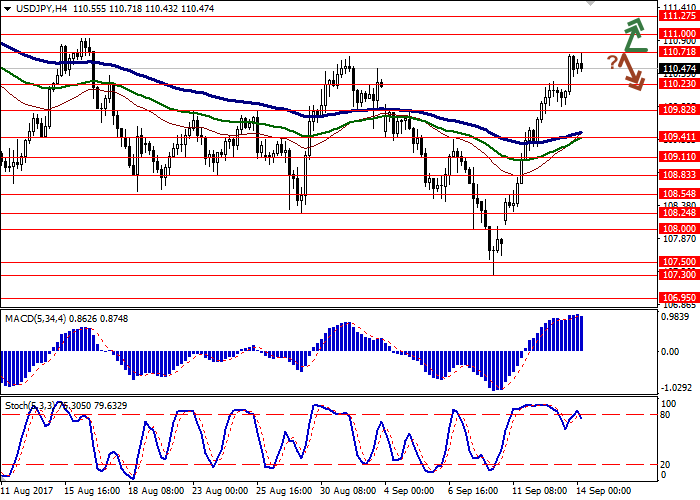
Resistance levels: 110.71, 111.00, 111.27.
Support levels: 110.23, 109.82, 109.41, 109.11.


Trading tips
Long positions may be opened after the outbreak of the levels 110.71 or 111.00 with targets at 111.50, 111.75 and top-loss at 110.50, 110.20. The period of implementation is 2-3 days.
A reversal near the level of 110.71 with further breakthrough of 110.23 may be a signal to the beginning of corrective sales of the instrument with targets around 109.40, 109.10. Stop-loss should be placed at the level of 111.00. The period of implementation is 2-3 days.
US dollar grew against Japanese yen as a result of trading on Wednesday, September 13, continuing the development of upward dynamics that started on Monday. Within 3 trading days the instrument managed to regain the positions lost last week and to marked a new local maximum since August 31.
Apart from technical factors, the instrument was supported by statement of Trump administration that the program of tax reforms may be presented next week.
On Thursday traders will focus their attention on consumer inflation statistics from the USA for August. The report is due at 14:30 (GMT+2).
Support and resistance
Bollinger Bands in D1 chart demonstrate moderate increase. The price range is narrowing from above. MACD indicator is growing preserving a stable buy signal (the histogram is above the signal line). Stochastic has reached maximum levels in the overbought zone and is trying to reverse horizontally.
Resistance levels: 110.71, 111.00, 111.27.
Support levels: 110.23, 109.82, 109.41, 109.11.


Trading tips
Long positions may be opened after the outbreak of the levels 110.71 or 111.00 with targets at 111.50, 111.75 and top-loss at 110.50, 110.20. The period of implementation is 2-3 days.
A reversal near the level of 110.71 with further breakthrough of 110.23 may be a signal to the beginning of corrective sales of the instrument with targets around 109.40, 109.10. Stop-loss should be placed at the level of 111.00. The period of implementation is 2-3 days.


No comments:
Write comments