
Visa Inc. (V/NYSE/S&P500)
07 September 2017, 13:59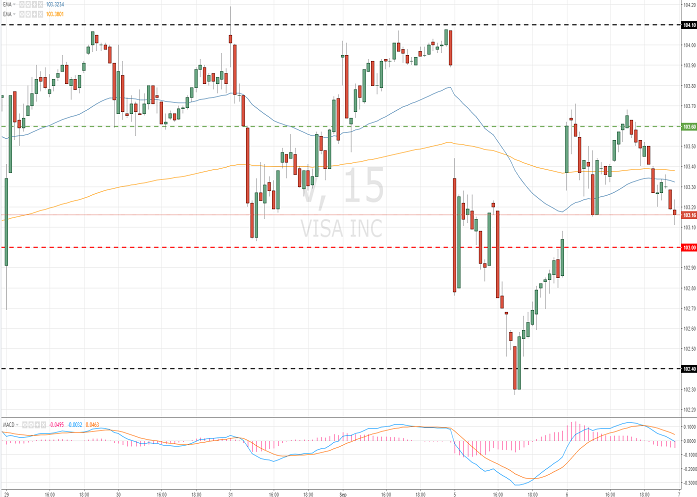
| Scenario | |
|---|---|
| Timeframe | Intraday |
| Recommendation | BUY STOP |
| Entry Point | 103.65 |
| Take Profit | 104.10, 104.60, 105.00 |
| Stop Loss | 103.10 |
| Key Levels | 101.70, 102.40, 103.00, 103.60, 104.10 |
| Alternative scenario | |
|---|---|
| Recommendation | SELL STOP |
| Entry Point | 102.90 |
| Take Profit | 102.00, 101.75 |
| Stop Loss | 103.50 |
| Key Levels | 101.70, 102.40, 103.00, 103.60, 104.10 |
Industry: credit services
Current trend
Comparative analysis of the financial activity and prices dynamics of Visa and MasterCard reflects that Visa is more investment appealing. Since the beginning of the year Visa stocks have brought the investors 32.25% against 28.71% of MasterCard. During last 4 reporting quarters Visa financial indicators exceeded the analysts’ expectation by 8.4% on average, as MasterCard ones only by 6.2%. The Wall Street analysts expect the growth of the year ETA in 2017 for Visa at the level of 20.3% against 16% of MasterCard.
During the last week Visa stocks decreased by 0.57% against the fall of the S&P 500 index by 0.61%.
The comparative analysis between the indicators of the company and its competitors suggest the neutrality of its share prices.
Key levels
On Tuesday, September, 5, the issuer kept the support level of 102.40, which caused the “bullish” moods. The moment the price is consolidating. Technical picture is mixed. The key support and resistance levels are 103.00 and 103.60 correspondingly. Indicators don’t give clear signals.
Resistance levels: 103.60, 104.10.
Support levels: 103.00, 102.40, 101.70.

Trading tips
If the price is set above the level of 103.60, it’s better to open long positions. Closing profitable positions is possible at the levels of 104.10, 104.60, 105.00. Stop loss is 103.10.
If the price breaks the round level of 103.00, find entering points to open short positions with the targets at 102.00–101.75. Stop loss is 103.50.
Implementation period: 3 days.
Current trend
Comparative analysis of the financial activity and prices dynamics of Visa and MasterCard reflects that Visa is more investment appealing. Since the beginning of the year Visa stocks have brought the investors 32.25% against 28.71% of MasterCard. During last 4 reporting quarters Visa financial indicators exceeded the analysts’ expectation by 8.4% on average, as MasterCard ones only by 6.2%. The Wall Street analysts expect the growth of the year ETA in 2017 for Visa at the level of 20.3% against 16% of MasterCard.
During the last week Visa stocks decreased by 0.57% against the fall of the S&P 500 index by 0.61%.
The comparative analysis between the indicators of the company and its competitors suggest the neutrality of its share prices.
Key levels
On Tuesday, September, 5, the issuer kept the support level of 102.40, which caused the “bullish” moods. The moment the price is consolidating. Technical picture is mixed. The key support and resistance levels are 103.00 and 103.60 correspondingly. Indicators don’t give clear signals.
Resistance levels: 103.60, 104.10.
Support levels: 103.00, 102.40, 101.70.
Trading tips
If the price is set above the level of 103.60, it’s better to open long positions. Closing profitable positions is possible at the levels of 104.10, 104.60, 105.00. Stop loss is 103.10.
If the price breaks the round level of 103.00, find entering points to open short positions with the targets at 102.00–101.75. Stop loss is 103.50.
Implementation period: 3 days.


No comments:
Write comments