
USD/CAD: the pair is growing
19 September 2017, 09:20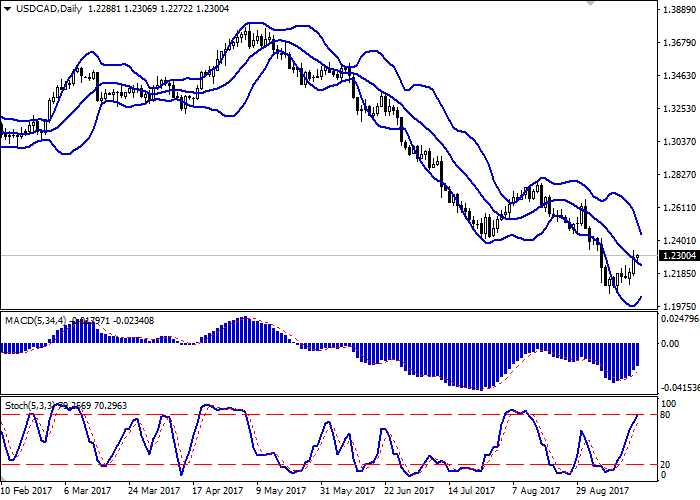
| Scenario | |
|---|---|
| Timeframe | Intraday |
| Recommendation | BUY STOP |
| Entry Point | 1.2310 |
| Take Profit | 1.2439, 1.2500 |
| Stop Loss | 1.2218, 1.2200 |
| Key Levels | 1.2060, 1.2129, 1.2218, 1.2300, 1.2360, 1.2412, 1.2439, 1.2500 |
| Alternative scenario | |
|---|---|
| Recommendation | SELL STOP |
| Entry Point | 1.2280 |
| Take Profit | 1.2129, 1.2060 |
| Stop Loss | 1.2400 |
| Key Levels | 1.2060, 1.2129, 1.2218, 1.2300, 1.2360, 1.2412, 1.2439, 1.2500 |
Current trend
US dollar showed growth against the Canadian currency as a result of trading on Monday, September 18, marking a new local maximum since September 6. The reason for speedy growth was expectation of the release of the Fed's minutes on Wednesday. The minutes may indicate the beginning of the program aimed at the reduction of the regulator's balance.
Additional pressure on the Canadian dollar was put by the statement of the representative of the Bank of Canada Lane. He pointed out that the central bank was closely monitoring market reaction to high interest rates and strong CAD. Moreover, Lane was not satisfied with high market uncertainly leading to the reduction of economic development prospects.
Support and resistance
Bollinger Bands on D1 chart demonstrate decrease. The price range is actively narrowing. MACD indicator is growing preserving a stable buy signal (the histogram is above the signal line). Stochastic keeps the upward direction but is located near the border with overbought area.
Resistance levels: 1.2300, 1.2360, 1.2412, 1.2439, 1.2500.
Support levels: 1.2218, 1.2129, 1.2060.
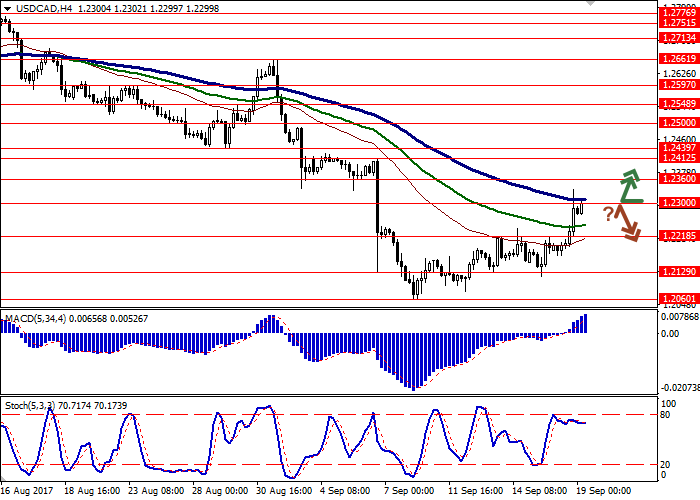

Trading tips
Long positions may be opened after breaking through the level of 1.2300 with targets at 1.2439, 1.2500 and stop-loss at 1.2218, 1.2200. The period of implementation is 2-3 days.
A reversal near the level of 1.2300 may indicate the opening of short positions with targets at 1.2129 or 1.2060 and stop-loss at 1.2400. The period of implementation is 2-3 days.
US dollar showed growth against the Canadian currency as a result of trading on Monday, September 18, marking a new local maximum since September 6. The reason for speedy growth was expectation of the release of the Fed's minutes on Wednesday. The minutes may indicate the beginning of the program aimed at the reduction of the regulator's balance.
Additional pressure on the Canadian dollar was put by the statement of the representative of the Bank of Canada Lane. He pointed out that the central bank was closely monitoring market reaction to high interest rates and strong CAD. Moreover, Lane was not satisfied with high market uncertainly leading to the reduction of economic development prospects.
Support and resistance
Bollinger Bands on D1 chart demonstrate decrease. The price range is actively narrowing. MACD indicator is growing preserving a stable buy signal (the histogram is above the signal line). Stochastic keeps the upward direction but is located near the border with overbought area.
Resistance levels: 1.2300, 1.2360, 1.2412, 1.2439, 1.2500.
Support levels: 1.2218, 1.2129, 1.2060.
Trading tips
Long positions may be opened after breaking through the level of 1.2300 with targets at 1.2439, 1.2500 and stop-loss at 1.2218, 1.2200. The period of implementation is 2-3 days.
A reversal near the level of 1.2300 may indicate the opening of short positions with targets at 1.2129 or 1.2060 and stop-loss at 1.2400. The period of implementation is 2-3 days.


No comments:
Write comments