
USD/JPY: dollar is growing at the beginning of the week
19 September 2017, 09:30
| Scenario | |
|---|---|
| Timeframe | Intraday |
| Recommendation | BUY STOP |
| Entry Point | 112.10 |
| Take Profit | 112.75, 113.00 |
| Stop Loss | 111.50 |
| Key Levels | 110.23, 110.71, 111.00, 111.27, 111.65, 112.00, 112.36 |
| Alternative scenario | |
|---|---|
| Recommendation | SELL STOP |
| Entry Point | 110.90 |
| Take Profit | 110.00, 109.50 |
| Stop Loss | 111.70 |
| Key Levels | 110.23, 110.71, 111.00, 111.27, 111.65, 112.00, 112.36 |
Current trend
The US dollar rose against the Japanese yen on September 19 hitting a new local maximum. The reason for the further growth of the US dollar was the positive expectations of the results of the Fed meeting, which will be held on Wednesday, September 20.
Analysts expect that the Fed will not change the interest rate level, but will announce the beginning of a program to reduce its own balance sheet, as the regulator representatives repeatedly spoke of earlier. In addition, the Fed will update the forecasts of economic development for the near future.
The Bank of Japan will issue its protocols on Thursday, September 21. As in the case of the Fed, the regulator of Japan won’t probably change the monetary policy, however the press conference of the head of the Central Bank may be interesting.
Support and resistance
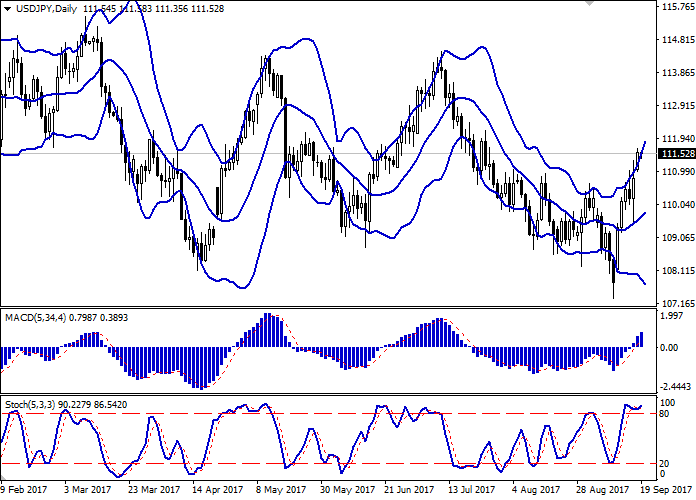
The indicator "Bollinger bands" on the daily chart shows moderate growth. The price range is expanding, but the price is located in close proximity to its upper border, which indicates a possible correction.
The MACD indicator does not contradict the further development of the "bullish" trend and calls for holding the existing long positions.
The Stochastic Oscillator is located in the overbought area, indicating a high risk of a corrective decline.
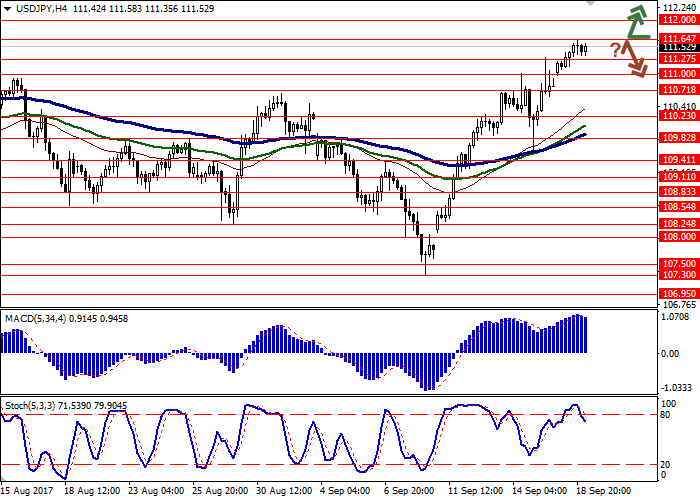
Resistance levels: 111.65, 112.00, 112.36.
Support levels: 111.27, 111.00, 110.71, 110.23.
Trading tips
To open long positions, you can rely on a breakout of the current resistance level at around 112.00. Take-profit – 112.75, 113.00. Stop-loss – 111.50. Terms of realization: 2 days.
An alternative may be a scenario with the correction and a reversal near the current price levels with a breakdown of 111.00. Take-profit – 110.00, 109.50. Stop loss is reasonable to place no further than 111.70. Terms of realization: 2-3 days.
The US dollar rose against the Japanese yen on September 19 hitting a new local maximum. The reason for the further growth of the US dollar was the positive expectations of the results of the Fed meeting, which will be held on Wednesday, September 20.
Analysts expect that the Fed will not change the interest rate level, but will announce the beginning of a program to reduce its own balance sheet, as the regulator representatives repeatedly spoke of earlier. In addition, the Fed will update the forecasts of economic development for the near future.
The Bank of Japan will issue its protocols on Thursday, September 21. As in the case of the Fed, the regulator of Japan won’t probably change the monetary policy, however the press conference of the head of the Central Bank may be interesting.
Support and resistance
The indicator "Bollinger bands" on the daily chart shows moderate growth. The price range is expanding, but the price is located in close proximity to its upper border, which indicates a possible correction.
The MACD indicator does not contradict the further development of the "bullish" trend and calls for holding the existing long positions.
The Stochastic Oscillator is located in the overbought area, indicating a high risk of a corrective decline.
Resistance levels: 111.65, 112.00, 112.36.
Support levels: 111.27, 111.00, 110.71, 110.23.
Trading tips
To open long positions, you can rely on a breakout of the current resistance level at around 112.00. Take-profit – 112.75, 113.00. Stop-loss – 111.50. Terms of realization: 2 days.
An alternative may be a scenario with the correction and a reversal near the current price levels with a breakdown of 111.00. Take-profit – 110.00, 109.50. Stop loss is reasonable to place no further than 111.70. Terms of realization: 2-3 days.


No comments:
Write comments