
Microsoft Corp.: wave analysis
19 September 2017, 09:09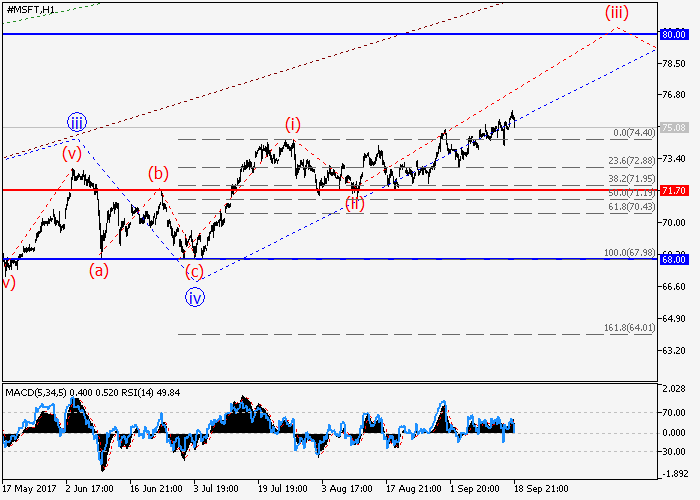
| Scenario | |
|---|---|
| Timeframe | Weekly |
| Recommendation | BUY |
| Entry Point | 74.97 |
| Take Profit | 80.00 |
| Stop Loss | 73.30 |
| Key Levels | 68.00, 71.70, 80.00 |
| Alternative scenario | |
|---|---|
| Recommendation | SELL STOP |
| Entry Point | 71.60 |
| Take Profit | 68.00 |
| Stop Loss | 72.80 |
| Key Levels | 68.00, 71.70, 80.00 |
The probability of an increase in the share’s price remains.
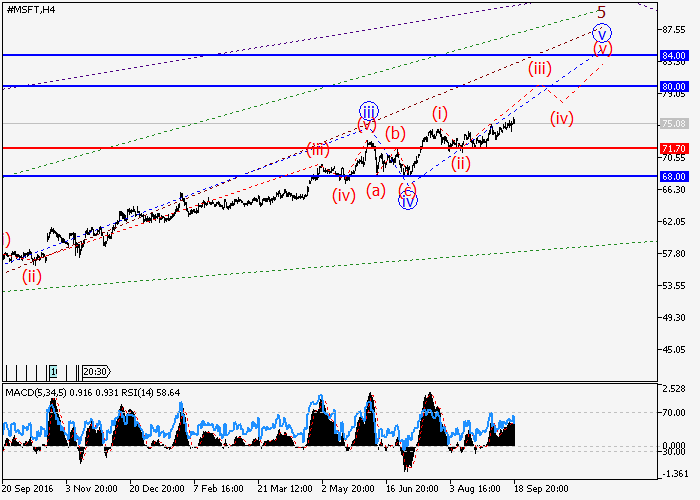
On the four-hour chart, the formation of the upward momentum continues as the fifth wave 5 of the higher level, within which the fifth wave v of 5 of the lower level develops. Locally, apparently, the third wave (iii) of v is developing. If the assumption is true, the price growth will continue to the level of 80.00. The level of 71.70 is critical for this scenario.

Main scenario
Buy the asset during the corrections, above the level of 71.70 with a target of 80.00.
Alternative scenario
Breakdown of the level of 71.70 will allow the asset to continue the decline to around 68.00.
On the four-hour chart, the formation of the upward momentum continues as the fifth wave 5 of the higher level, within which the fifth wave v of 5 of the lower level develops. Locally, apparently, the third wave (iii) of v is developing. If the assumption is true, the price growth will continue to the level of 80.00. The level of 71.70 is critical for this scenario.
Main scenario
Buy the asset during the corrections, above the level of 71.70 with a target of 80.00.
Alternative scenario
Breakdown of the level of 71.70 will allow the asset to continue the decline to around 68.00.


No comments:
Write comments