
NZD/USD: the pair is showing mixed dynamics
11 September 2017, 10:01
| Scenario | |
|---|---|
| Timeframe | Intraday |
| Recommendation | BUY |
| Entry Point | 0.7262 |
| Take Profit | 0.7297, 0.7336 |
| Stop Loss | 0.7220 |
| Key Levels | 0.7130, 0.7160, 0.7190, 0.7222, 0.7262, 0.7297, 0.7336, 0.7370 |
| Alternative scenario | |
|---|---|
| Recommendation | SELL STOP |
| Entry Point | 0.7200 |
| Take Profit | 0.7160, 0.7130 |
| Stop Loss | 0.7240 |
| Key Levels | 0.7130, 0.7160, 0.7190, 0.7222, 0.7262, 0.7297, 0.7336, 0.7370 |
Current trend
NZD showed stable growth during trading against US dollar on Friday, September 8, marking a new local maximum since August 10. However, the instrument failed to keep its positions, and by the moment of closing of the daily session it has lost the majority of its "bullish" advantage.
During the morning session the pair traded with a decrease which is partially explained by uncertain macroeconomic statistics from New Zealand. The value of sales with the use of electronic cards in August dropped by 0.2% MoM after a fall by 0.6% last month. YoY the indicator grew by 4.4% after growth by 2.0%.
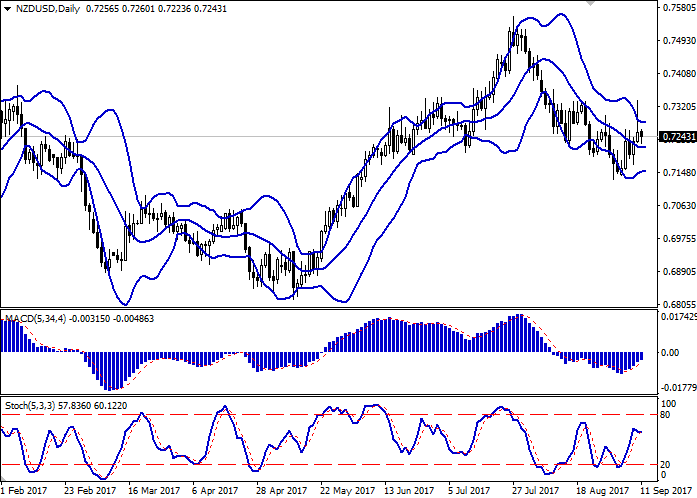
Support and resistance
Bollinger Bands on D1 chart demonstrate flat dynamics. The price range remains practically unchanged. MACD indicator is growing preserving a stable buy signal (the histogram is above the signal line). Stochastic has approached the border of the overbought area and is trying to reverse horizontally.
Resistance levels: 0.7262, 0.7297, 0.7336, 0.7370.
Support levels: 0.7222, 0.7190, 0.7160, 0.7130.
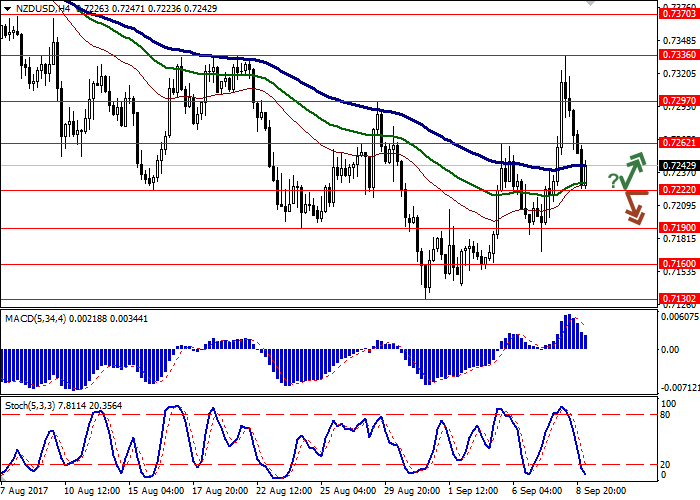
Trading tips
Long positions may be opened after a reversal around the level of 0.7222 with targets at 0.7297, 0.7336 and stop-loss at 0.7220. The period of implementation is 2-3 days.
Breaking down the level of 0.7222 may be a signal for sales with target around 0.7160 or 0.7130 and stop-loss at 0.7240. The period of implementation is 2 days.
NZD showed stable growth during trading against US dollar on Friday, September 8, marking a new local maximum since August 10. However, the instrument failed to keep its positions, and by the moment of closing of the daily session it has lost the majority of its "bullish" advantage.
During the morning session the pair traded with a decrease which is partially explained by uncertain macroeconomic statistics from New Zealand. The value of sales with the use of electronic cards in August dropped by 0.2% MoM after a fall by 0.6% last month. YoY the indicator grew by 4.4% after growth by 2.0%.
Support and resistance
Bollinger Bands on D1 chart demonstrate flat dynamics. The price range remains practically unchanged. MACD indicator is growing preserving a stable buy signal (the histogram is above the signal line). Stochastic has approached the border of the overbought area and is trying to reverse horizontally.
Resistance levels: 0.7262, 0.7297, 0.7336, 0.7370.
Support levels: 0.7222, 0.7190, 0.7160, 0.7130.
Trading tips
Long positions may be opened after a reversal around the level of 0.7222 with targets at 0.7297, 0.7336 and stop-loss at 0.7220. The period of implementation is 2-3 days.
Breaking down the level of 0.7222 may be a signal for sales with target around 0.7160 or 0.7130 and stop-loss at 0.7240. The period of implementation is 2 days.


No comments:
Write comments