NZD/USD: the pair continues to grow
13 September 2017, 10:12
| Scenario | |
|---|---|
| Timeframe | Intraday |
| Recommendation | BUY STOP |
| Entry Point | 0.7325, 0.7340 |
| Take Profit | 0.7370, 0.7400 |
| Stop Loss | 0.7275 |
| Key Levels | 0.7130, 0.7160, 0.7190, 0.7222, 0.7256, 0.7297, 0.7319, 0.7336, 0.7370 |
| Alternative scenario | |
|---|---|
| Recommendation | SELL STOP |
| Entry Point | 0.7280 |
| Take Profit | 0.7250, 0.7220 |
| Stop Loss | 0.7310 |
| Key Levels | 0.7130, 0.7160, 0.7190, 0.7222, 0.7256, 0.7297, 0.7319, 0.7336, 0.7370 |
Current trend
NZD showed considerable growth against US currency as a result of trading on Tuesday, September 12, getting close to its local maximum dated September 8. However, the trading was quite volatile due to the attempts of USD to grow in view of decreased tension around North Korea.
During the morning session on September 13 the pair has been staying around the opening levels after a slight fall at the opening caused by technical factors. The pair received moderate support from the data on the dynamics of food products prices in New Zealand. In August the indicator grew by 0.6% MoM after a fall by 0.2% in the previous month. Given the focus of the New Zealand economy on the export of agricultural products and food, this indicator seems very important.
Support and resistance
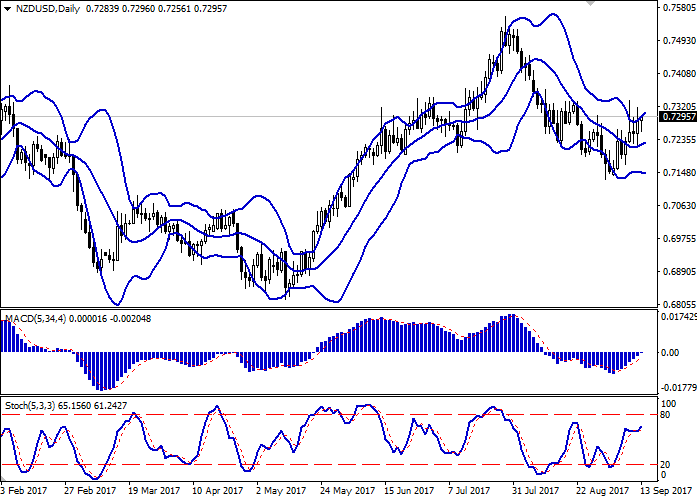
Bollinger Bands in D1 chart demonstrate moderate increase. The price range is widening. MACD indicator is growing preserving a stable buy signal (the histogram is above the signal line). Stochastic resumed growth after a short period of side dynamics.
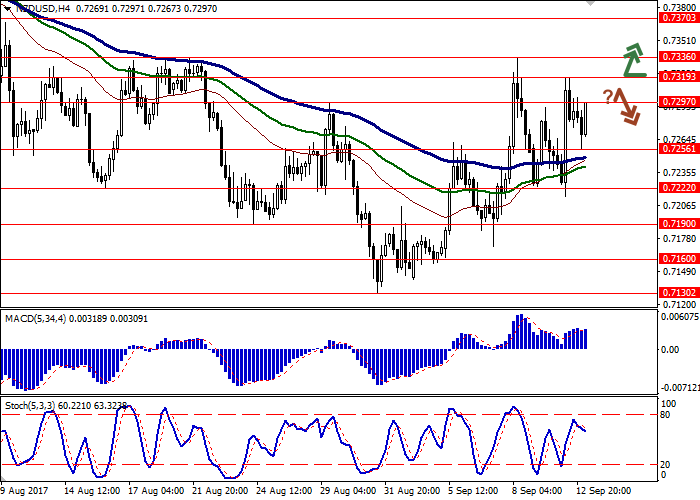
Resistance levels: 0.7297, 0.7319, 0.7336, 0.7370.
Support levels: 0.7256, 0.7222, 0.7190, 0.7160, 0.7130.


Trading tips
Long positions may be opened after the outbreak of the levels 0.7319 or 0.7336 with targets at 0.7370, 0.7400 and top-loss at 0.7275. The period of implementation is 2-3 days.
A reversal near current price levels may be yet another signal for the beginning of corrective dynamics with target around 0.7250, 0.7220 and stop-loss at 0.7310. The period of implementation is 1-2 days.
NZD showed considerable growth against US currency as a result of trading on Tuesday, September 12, getting close to its local maximum dated September 8. However, the trading was quite volatile due to the attempts of USD to grow in view of decreased tension around North Korea.
During the morning session on September 13 the pair has been staying around the opening levels after a slight fall at the opening caused by technical factors. The pair received moderate support from the data on the dynamics of food products prices in New Zealand. In August the indicator grew by 0.6% MoM after a fall by 0.2% in the previous month. Given the focus of the New Zealand economy on the export of agricultural products and food, this indicator seems very important.
Support and resistance
Bollinger Bands in D1 chart demonstrate moderate increase. The price range is widening. MACD indicator is growing preserving a stable buy signal (the histogram is above the signal line). Stochastic resumed growth after a short period of side dynamics.
Resistance levels: 0.7297, 0.7319, 0.7336, 0.7370.
Support levels: 0.7256, 0.7222, 0.7190, 0.7160, 0.7130.


Trading tips
Long positions may be opened after the outbreak of the levels 0.7319 or 0.7336 with targets at 0.7370, 0.7400 and top-loss at 0.7275. The period of implementation is 2-3 days.
A reversal near current price levels may be yet another signal for the beginning of corrective dynamics with target around 0.7250, 0.7220 and stop-loss at 0.7310. The period of implementation is 1-2 days.


No comments:
Write comments