Brent Crude Oil: the dynamics is flat
13 September 2017, 10:04
| Scenario | |
|---|---|
| Timeframe | Intraday |
| Recommendation | BUY STOP |
| Entry Point | 54.20, 54.35 |
| Take Profit | 55.00 |
| Stop Loss | 53.50 |
| Key Levels | 51.25, 51.85, 52.27, 52.80, 53.40, 54.16, 54.63, 55.00 |
| Alternative scenario | |
|---|---|
| Recommendation | SELL STOP |
| Entry Point | 53.40 |
| Take Profit | 52.50, 52.00 |
| Stop Loss | 54.00 |
| Key Levels | 51.25, 51.85, 52.27, 52.80, 53.40, 54.16, 54.63, 55.00 |
Current trend
On Tuesday, September, 12, Brent oil prices significantly grew, partially restored the fall of the instrument during last Friday and the weak beginning of the week. The price was supported by the OPEC statements that August oil production volumes went down again by 79K barrel per day to 32.76 million barrel per day. In addition, OPEC has significantly increased the forecast on the demand on oil in 2018.
API Weekly Crude Oil Stock publication affected the price positively, too. According to the report, the volume of recourses grew by 6.181 million barrel after the growth by 2.791 million barrel during the previous period. On Wednesday, September, 13, the investors are waiting for the conformation of the data by EIA. The report will be published at 16:30 (GMT+2).
Support and resistance
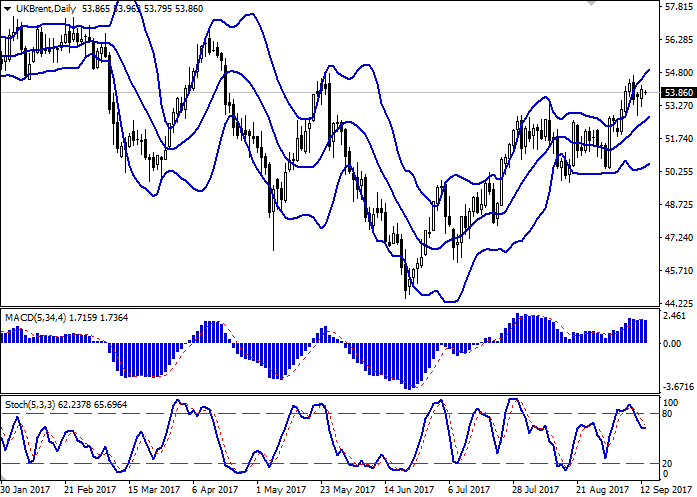
On the daily chart Bollinger Bands are moderately growing. The price range is widening, being enough wide for the current volatility level. The indicator doesn’t contradict with the further development of the “bullish” trend.
MACD is pointed downwards and gives a weak sell signal (the histogram is below the signal line). The readings of the indicator correlate with the actual dynamics weakly, so it’s better to wait until the signal is clear.
Stochastic, which was falling in the beginning of the week, reversed into flat, reacting to the “bullish” dynamics appearance on Tuesday. It’s better to wait until the signal is clear.
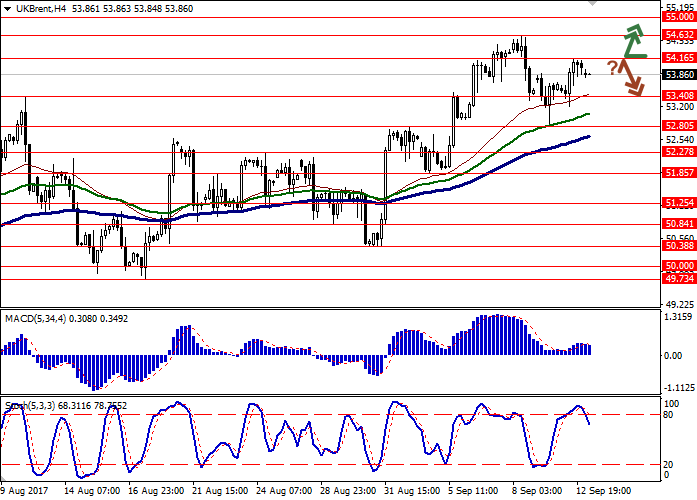
Resistance levels: 54.16, 54.63, 55.00.
Support levels: 53.40, 52.80, 52.27, 51.85, 51.25.


Trading tips
Long positions can be opened after the breakout of the levels of 54.16–54.30. Take profit is 55.00. Stop loss is 53.50. Implementation period: 1-2 days.
The downward reversal around 54.16 and the following breakdown of the level of 53.40 can reflect the new wave of correctional sales appearance with the targets at around 52.50–52.00. Stop loss is not further than 54.20. Implementation period: 2-3 days.
On Tuesday, September, 12, Brent oil prices significantly grew, partially restored the fall of the instrument during last Friday and the weak beginning of the week. The price was supported by the OPEC statements that August oil production volumes went down again by 79K barrel per day to 32.76 million barrel per day. In addition, OPEC has significantly increased the forecast on the demand on oil in 2018.
API Weekly Crude Oil Stock publication affected the price positively, too. According to the report, the volume of recourses grew by 6.181 million barrel after the growth by 2.791 million barrel during the previous period. On Wednesday, September, 13, the investors are waiting for the conformation of the data by EIA. The report will be published at 16:30 (GMT+2).
Support and resistance
On the daily chart Bollinger Bands are moderately growing. The price range is widening, being enough wide for the current volatility level. The indicator doesn’t contradict with the further development of the “bullish” trend.
MACD is pointed downwards and gives a weak sell signal (the histogram is below the signal line). The readings of the indicator correlate with the actual dynamics weakly, so it’s better to wait until the signal is clear.
Stochastic, which was falling in the beginning of the week, reversed into flat, reacting to the “bullish” dynamics appearance on Tuesday. It’s better to wait until the signal is clear.
Resistance levels: 54.16, 54.63, 55.00.
Support levels: 53.40, 52.80, 52.27, 51.85, 51.25.


Trading tips
Long positions can be opened after the breakout of the levels of 54.16–54.30. Take profit is 55.00. Stop loss is 53.50. Implementation period: 1-2 days.
The downward reversal around 54.16 and the following breakdown of the level of 53.40 can reflect the new wave of correctional sales appearance with the targets at around 52.50–52.00. Stop loss is not further than 54.20. Implementation period: 2-3 days.


No comments:
Write comments