XAG/USD: silver dynamics is mixed
13 September 2017, 10:34
| Scenario | |
|---|---|
| Timeframe | Intraday |
| Recommendation | BUY |
| Entry Point | 17.90 |
| Take Profit | 18.20, 18.30 |
| Stop Loss | 17.80, 17.70 |
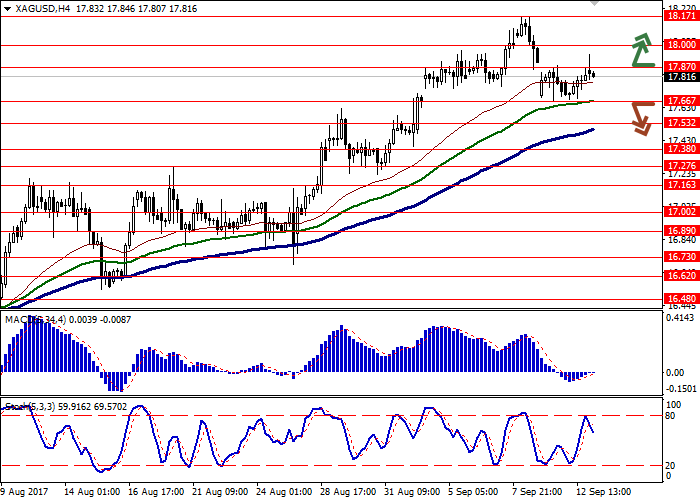
| Key Levels | 17.16, 17.27, 17.38, 17.53, 17.66, 17.87, 18.00, 18.17 |
| Alternative scenario | |
|---|---|
| Recommendation | SELL STOP |
| Entry Point | 17.63 |
| Take Profit | 17.30 |
| Stop Loss | 17.90 |
| Key Levels | 17.16, 17.27, 17.38, 17.53, 17.66, 17.87, 18.00, 18.17 |
Current trend
During trading session on Tuesday, September, 12, silver prices insignificantly grew and stepped off the local minimum since the beginning of the month. The instrument is trying to enter the upward correction after downward gap opening on Monday due to the fall of the market demand on shelter assets after DPRK refused to test missiles last weekend, which helped to release the tense upon the North Korea situation.
On Wednesday, September, 13, the investors are waiting for Producer Price Index publication at 14:30 (GMT+2) in the USA. The MoM value is expected to grow by 0.3% MoM after the fall by 0.1% MoM in the previous month. In addition, the Monthly Budget Statement will be published at 20:00 (GMT+2) in the USA.
Support and resistance
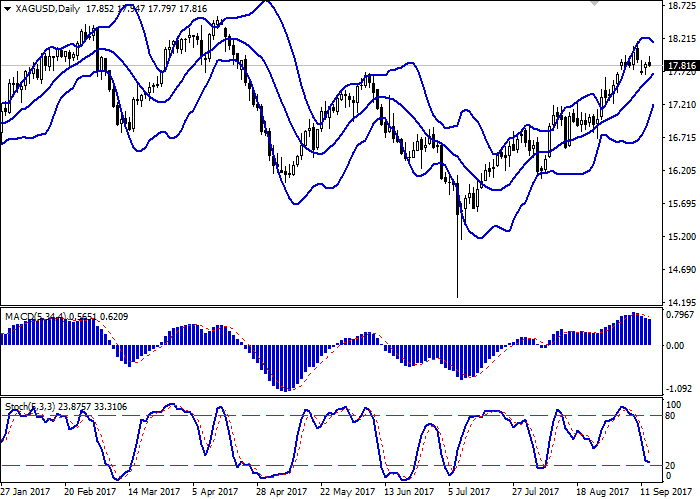
On the daily chart Bollinger Bands are steady growing. The price range is narrowing, reflecting the appearance of the controversial trade dynamic this week. It’s better to use the channel trading strategy.
MACD is going down, keeping weakening sell signal (the histogram is below the signal line). It’s better to wait until the signal is clear, as current readings are uninformative.
Stochastic has reached the border of the oversold area and reversed into flat, reacting to the attempt of correctional growth in the beginning of the week. It’s better to wait until the situation is clear and the indicator reverses fully.
Resistance levels: 17.87, 18.00, 18.17.
Support levels: 17.66, 17.53, 17.38, 17.27, 17.16.


Trading tips
Long positions can be opened after the breakout of the levels of 17.87 or 18.00. Take profit is 18.20–18.30. Stop loss is 17.80–17.70. Implementation period: 2-3 days.
The alternative is the return of strong “bearish” trend after the breakdown of the level of 17.66. In this case it’s better to open short positions with the target around 17.30. Stop loss is 17.90. Implementation period: 2-3 days.
During trading session on Tuesday, September, 12, silver prices insignificantly grew and stepped off the local minimum since the beginning of the month. The instrument is trying to enter the upward correction after downward gap opening on Monday due to the fall of the market demand on shelter assets after DPRK refused to test missiles last weekend, which helped to release the tense upon the North Korea situation.
On Wednesday, September, 13, the investors are waiting for Producer Price Index publication at 14:30 (GMT+2) in the USA. The MoM value is expected to grow by 0.3% MoM after the fall by 0.1% MoM in the previous month. In addition, the Monthly Budget Statement will be published at 20:00 (GMT+2) in the USA.
Support and resistance
On the daily chart Bollinger Bands are steady growing. The price range is narrowing, reflecting the appearance of the controversial trade dynamic this week. It’s better to use the channel trading strategy.
MACD is going down, keeping weakening sell signal (the histogram is below the signal line). It’s better to wait until the signal is clear, as current readings are uninformative.
Stochastic has reached the border of the oversold area and reversed into flat, reacting to the attempt of correctional growth in the beginning of the week. It’s better to wait until the situation is clear and the indicator reverses fully.
Resistance levels: 17.87, 18.00, 18.17.
Support levels: 17.66, 17.53, 17.38, 17.27, 17.16.


Trading tips
Long positions can be opened after the breakout of the levels of 17.87 or 18.00. Take profit is 18.20–18.30. Stop loss is 17.80–17.70. Implementation period: 2-3 days.
The alternative is the return of strong “bearish” trend after the breakdown of the level of 17.66. In this case it’s better to open short positions with the target around 17.30. Stop loss is 17.90. Implementation period: 2-3 days.


No comments:
Write comments