
GBP/USD: wave analysis
20 September 2017, 09:12
| Scenario | |
|---|---|
| Timeframe | Weekly |
| Recommendation | BUY |
| Entry Point | 1.3526 |
| Take Profit | 1.3700, 1.4000 |
| Stop Loss | 1.3460 |
| Key Levels | 1.2765, 1.3266, 1.3700, 1.4000 |
| Alternative scenario | |
|---|---|
| Recommendation | SELL STOP |
| Entry Point | 1.3260 |
| Take Profit | 1.2765 |
| Stop Loss | 1.3425 |
| Key Levels | 1.2765, 1.3266, 1.3700, 1.4000 |
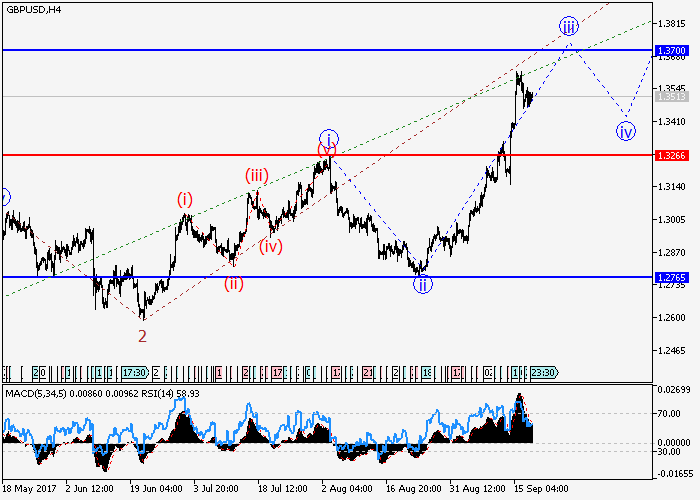
The upward trend is in force.
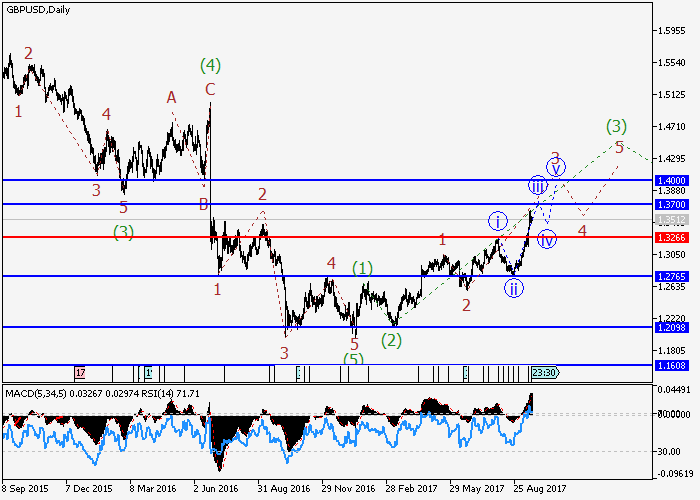
The daily chart continues to develop an uptrend within the third wave (3) of the higher level. Locally, apparently, the third wave iii of 3 of (3) of the lower level is forming. If the assumption is true, then the pair's growth will continue to the levels of 1.3700-1.4000. The level of 1.3266 is critical for this scenario.
Main scenario
Buy during corrections, above the level of 1.3266 with a target in the range of 1.3700-1.4000.
Alternative scenario
Breakdown of the level of 1.3266 will allow the pair to continue the decline to the level of 1.2765.


No comments:
Write comments