
ATT Inc.: wave analysis
20 September 2017, 09:14
| Scenario | |
|---|---|
| Timeframe | Weekly |
| Recommendation | BUY |
| Entry Point | 38.09 |
| Take Profit | 42.50 |
| Stop Loss | 36.60 |
| Key Levels | 31.80, 35.00, 42.50 |
| Alternative scenario | |
|---|---|
| Recommendation | SELL STOP |
| Entry Point | 34.90 |
| Take Profit | 31.80 |
| Stop Loss | 35.95 |
| Key Levels | 31.80, 35.00, 42.50 |
The probability of a price increase remains.
On the H4 chart, formation of a downward correction of the higher level as wave 2 was completed. Locally, apparently, a low-level input pulse is forming. If the assumption is true, it is logical to expect the continued growth in the price to around 42.50. The level of 35.00 is critical for this scenario, the breakdown of which will lead to a price reduction.
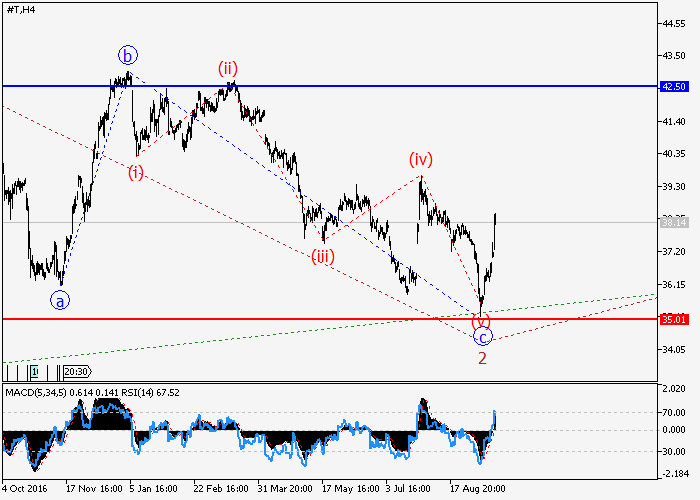
Main scenario
Buy during correction, above the level of 35.00 with a target at 42.50.
Alternative scenario
Breakdown of the level of 35.00 will allow the shares to continue the decline to the level of 31.80.
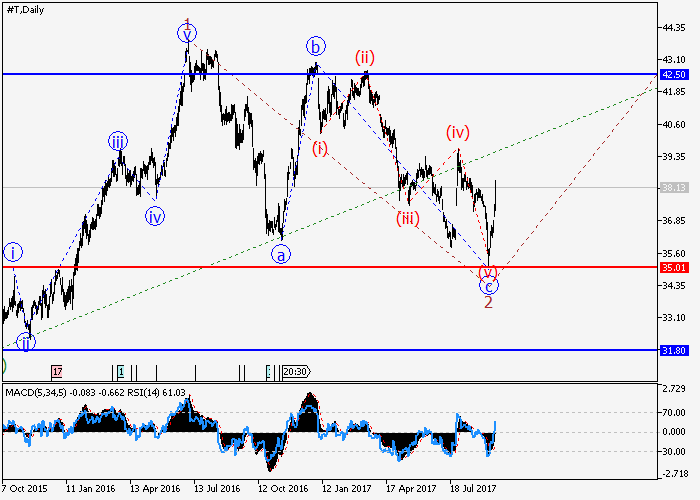
On the H4 chart, formation of a downward correction of the higher level as wave 2 was completed. Locally, apparently, a low-level input pulse is forming. If the assumption is true, it is logical to expect the continued growth in the price to around 42.50. The level of 35.00 is critical for this scenario, the breakdown of which will lead to a price reduction.
Main scenario
Buy during correction, above the level of 35.00 with a target at 42.50.
Alternative scenario
Breakdown of the level of 35.00 will allow the shares to continue the decline to the level of 31.80.


No comments:
Write comments