
Alibaba Group Holding Limited (BABA/NYSE)
11 September 2017, 12:03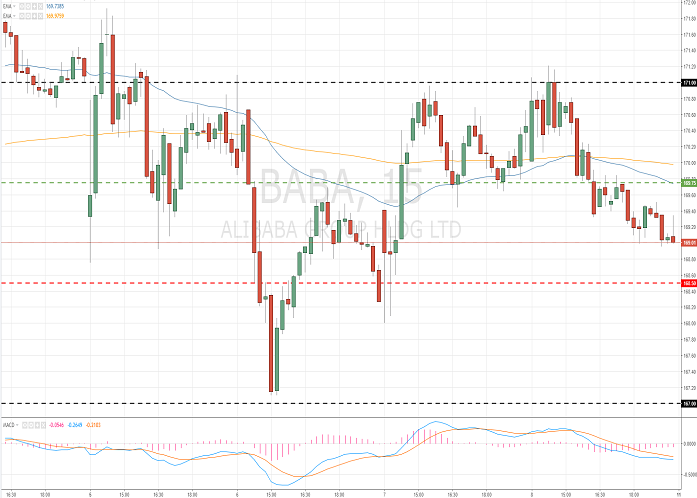
| Scenario | |
|---|---|
| Timeframe | Intraday |
| Recommendation | BUY STOP |
| Entry Point | 169.80 |
| Take Profit | 170.75, 171.75, 172.50 |
| Stop Loss | 168.75 |
| Key Levels | 165.00, 167.00, 168.50, 169.75, 171.00, 172.50 |
| Alternative scenario | |
|---|---|
| Recommendation | SELL STOP |
| Entry Point | 168.40 |
| Take Profit | 166.50, 166.00 |
| Stop Loss | 169.50 |
| Key Levels | 165.00, 167.00, 168.50, 169.75, 171.00, 172.50 |
Industry: specialized goods retail sale
Current trend
Since the publication on August, 17, strong Q1 2018 financial report Alibaba Group has brought its shareholders around 5% and more 92% — since the beginning of 2017. The income of the company record grew by 56% YoY due to increase of online sale, which exceeded the market expectations. The income for the shareholders doubled to 2.17 billion USD. Alibaba Group has increased the year income forecast to 45–49%.
During the last week Alibaba Group stocks grew by 2.07% against the decrease of the S&P 500 index by 0.54%.
The comparative analysis between the indicators of the company and its competitors suggest the neutrality of its share prices.
Key levels
The technical picture is controversial. Since the beginning of the month the issuer is moving sideways. The key support and resistance levels are 168.50 and 169.75 correspondingly. Indicators don’t give clear signals.
Support levels: 168.50, 167.00, 165.00.
Resistance levels: 169.75, 171.00, 172.50.

Trading tips
If the price is set above the level of 169.75, it’s better to open long positions. Closing profitable positions is possible at the levels of 170.75, 171.75, 172.50. Stop loss is 168.75.
If the price is set below the support level of 168.50, find entering points to open short positions with the targets at 166.50–166.00. Stop loss is 169.50.
Implementation period: 3 days.
Current trend
Since the publication on August, 17, strong Q1 2018 financial report Alibaba Group has brought its shareholders around 5% and more 92% — since the beginning of 2017. The income of the company record grew by 56% YoY due to increase of online sale, which exceeded the market expectations. The income for the shareholders doubled to 2.17 billion USD. Alibaba Group has increased the year income forecast to 45–49%.
During the last week Alibaba Group stocks grew by 2.07% against the decrease of the S&P 500 index by 0.54%.
The comparative analysis between the indicators of the company and its competitors suggest the neutrality of its share prices.
Key levels
The technical picture is controversial. Since the beginning of the month the issuer is moving sideways. The key support and resistance levels are 168.50 and 169.75 correspondingly. Indicators don’t give clear signals.
Support levels: 168.50, 167.00, 165.00.
Resistance levels: 169.75, 171.00, 172.50.
Trading tips
If the price is set above the level of 169.75, it’s better to open long positions. Closing profitable positions is possible at the levels of 170.75, 171.75, 172.50. Stop loss is 168.75.
If the price is set below the support level of 168.50, find entering points to open short positions with the targets at 166.50–166.00. Stop loss is 169.50.
Implementation period: 3 days.


No comments:
Write comments