XAU/USD: investors turn to gold in anticipation of a US recession
28 July 2022, 11:40

| Scenario | |
|---|---|
| Timeframe | Weekly |
| Recommendation | BUY STOP |
| Entry Point | 1752.0 |
| Take Profit | 1807.0 |
| Stop Loss | 1720.0 |
| Key Levels | 1681.0, 1717.0, 1752.0, 1808.0 |
| Alternative scenario | |
|---|---|
| Recommendation | SELL STOP |
| Entry Point | 1717.0 |
| Take Profit | 1681.0 |
| Stop Loss | 1730.0 |
| Key Levels | 1681.0, 1717.0, 1752.0, 1808.0 |
Current trend
The quotes of the XAU/USD pair reversed at the solid multi-year support around 1700.0 and began to grow. The trading instrument is correcting within an uptrend of around 1,738K dollars per ounce.
Investors continue to monitor the economic situation in the US. Today, data on Q2 GDP will be presented, and preliminary estimates of experts have recorded a resumption of positive dynamics, reaching a value of 0.5% after falling by 1.6% in the previous period. However, since the publication of statistics for the first quarter, US Federal Reserve officials raised the interest rate by 1.50%, and inflation accelerated from 7.0% to 9.1%, which is completely contrary to positive forecasts. Traders are focused on the comments of US Treasury Secretary Janet Yellen, who will make a speech immediately after the release. Earlier, the official stated the need to reduce inflation, considering preserving a strong economy. While a recession is becoming inevitable, she says there are no signs of a downturn.
Meanwhile, traders are more actively redirecting their capital to the assets of the metal group, which traditionally act as a risk hedging instrument. The growth in the attractiveness of gold is confirmed by data on a sharp reduction in short positions to the highest value in the last five years – 20.180. At the same time, the buyers' positions for the last week increased by 2.832 contracts.
Support and resistance
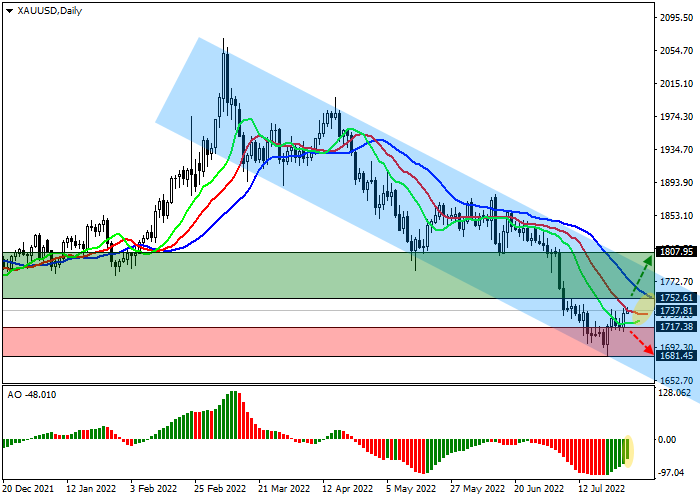
On the daily chart, the formation of a wide downwards channel with dynamic boundaries 1800.0–1650.0 continues, and now the price is growing towards the resistance line. Technical indicators weaken the sell signal: fast EMAs on the Alligator indicator are actively approaching the signal line, and the AO oscillator histogram, being in the sell zone, is forming new rising bars.
Support levels: 1717.0, 1681.0.
Resistance levels: 1752.0, 1808.0.

Trading tips
Long positions may be opened after the continuation of the local growth of the asset or consolidation above the resistance level of 1752.0 with the target at 1807.0. Stop loss – 1720.0. Implementation period: 7 days or more.
Short positions may be opened after a reversal and continued decline in the asset or consolidation below the local support level of 1717.0 with the target at 1681.0. Stop loss – 1730.0.


No comments:
Write comments