
USD/JPY: multidirectional trend
18 March 2021, 09:39
| Scenario | |
|---|---|
| Timeframe | Intraday |
| Recommendation | SELL STOP |
| Entry Point | 108.55 |
| Take Profit | 107.78 |
| Stop Loss | 109.10 |
| Key Levels | 107.42, 107.78, 108.15, 108.61, 109.00, 109.37, 109.84, 110.23 |
| Alternative scenario | |
|---|---|
| Recommendation | BUY STOP |
| Entry Point | 109.40 |
| Take Profit | 110.23, 110.30 |
| Stop Loss | 108.90 |
| Key Levels | 107.42, 107.78, 108.15, 108.61, 109.00, 109.37, 109.84, 110.23 |
Current trend
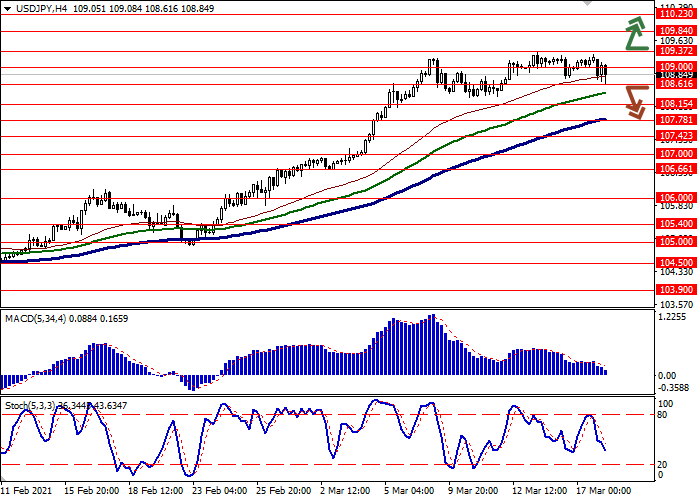
USD shows multidirectional dynamics of trading against JPY during today's Asian session, consolidating below the level of 109.00.
The day before, the instrument showed a moderate decline caused by the publication of the minutes of the US Federal Reserve meeting. The regulator raised its forecasts for the growth rate of the US economy in 2021, while not responding to the recent rise in Treasury yields, still believing that this will not cause a sharp increase in inflationary pressures in the markets.
At the same time, weak export statistics from Japan exerted moderate pressure on JPY on Wednesday. In February, export volumes fell sharply by 4.5% YoY after growing by 6.4% YoY in the previous month. Analysts had expected negative dynamics at –0.8% YoY. Foreign Bond Investment indicator for the week ending March 12 fell sharply by JPY 417 billion after rising by JPY 111.7 billion in the previous period.
Support and resistance
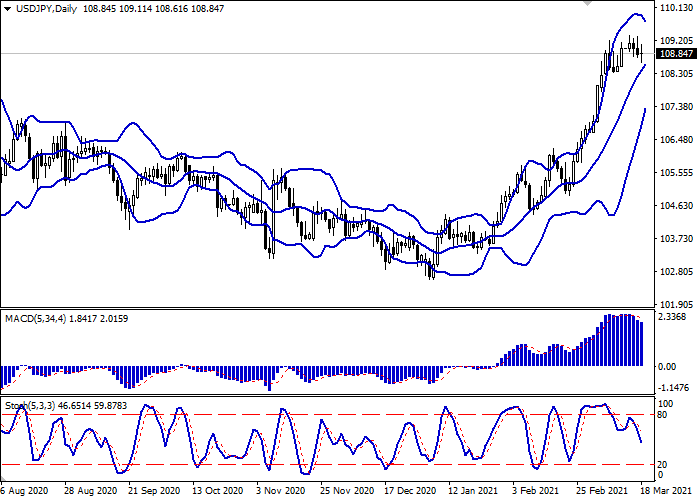
Bollinger Bands on the daily chart are showing solid gains driven by the recent rally in USD. The price range is narrowing, reflecting multidirectional nature of trading in the short term. MACD is going down keeping a fairly stable sell signal (located below the signal line). Stochastic is showing similar dynamics being located in the middle of its area.
Existing short positions should be kept until technical indicators are clarified.
Resistance levels: 109.00, 109.37, 109.84, 110.23.
Support levels: 108.61, 108.15, 107.78, 107.42.

Trading tips
To open new short positions, one can rely on the breakdown of 108.61. Take-profit – 107.78. Stop-loss – 109.10. Implementation time: 1-2 days.
The breakout of 109.37 may serve as a signal to new purchases with the targets at 110.23–110.30. Stop-loss – 108.90.


No comments:
Write comments