
EUR/USD: correction after significant growth
18 March 2021, 09:25

| Scenario | |
|---|---|
| Timeframe | Intraday |
| Recommendation | BUY STOP |
| Entry Point | 1.2005 |
| Take Profit | 1.2100 |
| Stop Loss | 1.1950 |
| Key Levels | 1.1800, 1.1834, 1.1900, 1.1950, 1.2000, 1.2022, 1.2070, 1.2100 |
| Alternative scenario | |
|---|---|
| Recommendation | SELL STOP |
| Entry Point | 1.1945 |
| Take Profit | 1.1834 |
| Stop Loss | 1.2000 |
| Key Levels | 1.1800, 1.1834, 1.1900, 1.1950, 1.2000, 1.2022, 1.2070, 1.2100 |
Current trend
EUR is declining against USD during today's Asian session, correcting after a significant increase the day before, which was triggered by the publication of moderately optimistic minutes of the Fed’s meeting.
The American regulator did not change the parameters of monetary policy, indicating that rates will remain at their lowest levels until the end of 2023. At the same time, forecasts for the growth rate of US GDP have significantly increased. At the end of 2021, the Fed expects the US economy to grow by an impressive 6.5% YoY, while the December forecast assumed growth of only 4.2% YoY.
Wednesday's macroeconomic statistics from eurozone did not have a noticeable impact on the instrument's dynamics. The Consumer Price Index in February showed an increase by the previous 0.2% MoM, and in annual terms it added 0.9% YoY, which also corresponded to the market forecasts. Today, European investors are focused on the speech of the European Central Bank President Christine Lagarde and the ECB Vice-President Luis de Guindos.
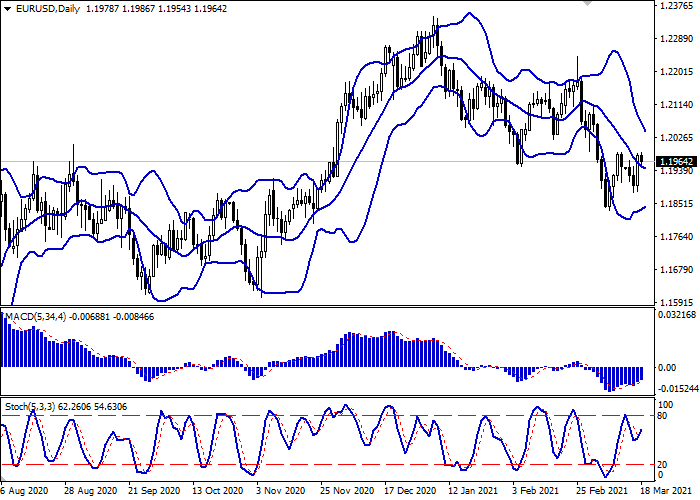
Support and resistance
On the D1 chart, Bollinger Bands are gradually reversing horizontally. The price range is narrowing from above, reflecting the emergence of ambiguous dynamics in the short term. MACD indicator is growing preserving a moderate buy signal (located above the signal line). Stochastic reversed upwards again after a short decline at the beginning of the week, while being at the level of "80".
Resistance levels: 1.2000, 1.2022, 1.2070, 1.2100.
Support levels: 1.1950, 1.1900, 1.1834, 1.1800.
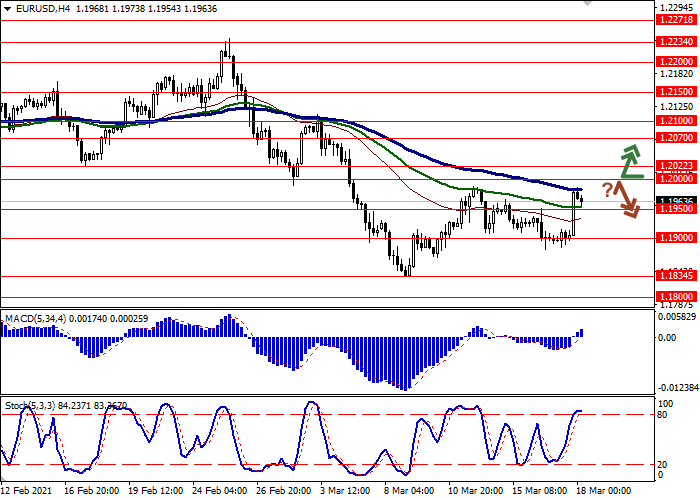
Trading tips
To open long positions, one can rely on the breakout of 1.2000. Take-profit – 1.2100. Stop-loss – 1.1950. Implementation time: 2-3 days.
A rebound from 1.2000 as from resistance, followed by a breakdown of 1.1950 may become a signal for new sales with the target at 1.1834. Stop-loss – 1.2000.


No comments:
Write comments