
USD/JPY: USD is strengthening
15 February 2021, 08:48
| Scenario | |
|---|---|
| Timeframe | Intraday |
| Recommendation | BUY STOP |
| Entry Point | 105.20 |
| Take Profit | 105.60, 105.79 |
| Stop Loss | 104.85 |
| Key Levels | 103.90, 104.20, 104.50, 104.75, 105.17, 105.33, 105.60, 105.79 |
| Alternative scenario | |
|---|---|
| Recommendation | SELL STOP |
| Entry Point | 104.70 |
| Take Profit | 104.20 |
| Stop Loss | 105.00 |
| Key Levels | 103.90, 104.20, 104.50, 104.75, 105.17, 105.33, 105.60, 105.79 |
Current trend
USD has shown strong gains against JPY during today's Asian session, once again trying to consolidate above 105.00.
The focus is on macroeconomic statistics from Japan, which was encouraging for Japanese investors, but still did not lead to a change in the trading direction in the short term. Annual data on Japan's GDP reflected the country's economic growth in Q4 2020 by 12.7% YoY after increasing by 22.7% YoY in the previous period. Experts expected a slowdown in GDP to +9.5% YoY. In quarterly terms, the economy slowed down from +5.3% QoQ to +3% QoQ, which was also better than market expectations at +2.3% QoQ. Industrial production dynamics slightly improved from –3.2% YoY to –2.6% YoY, with market neutral forecasts.
Support and resistance
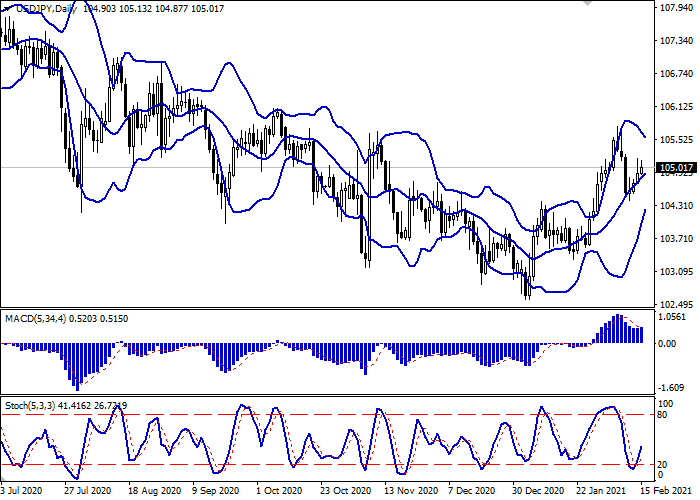
Bollinger Bands in D1 chart show stable growth. The price range is narrowing, reflecting the ambiguous nature of trading in the short/middle term. MACD indicator reverses to growth while forming a new buy signal (the histogram is about to consolidate above the signal line). Stochastic is actively recovering from its lows, indicating the prospects for the development of corrective growth of the instrument in the ultra-short term.
Current showings of the indicators do not contradict the development of the uptrend in the short term.
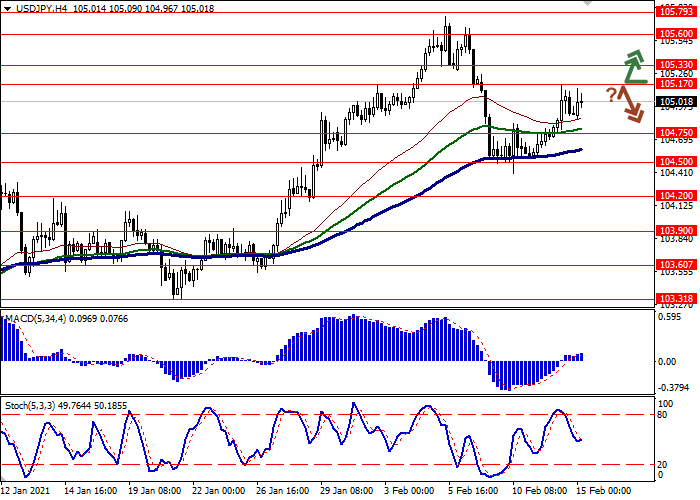
Resistance levels: 105.17, 105.33, 105.60, 105.79.
Support levels: 104.75, 104.50, 104.20, 103.90.

Trading tips
To open long positions, one can rely on the breakout of 105.17. Take-profit – 105.60–105.79. Stop-loss – 104.85. Implementation time: 1-2 days.
A rebound from 105.17 as from resistance, followed by a breakdown of 104.75 may become a signal for new sales with the target at 104.20. Stop-loss – 105.00.


No comments:
Write comments