
EUR/USD: flat dynamics
15 February 2021, 08:52

| Scenario | |
|---|---|
| Timeframe | Intraday |
| Recommendation | BUY STOP |
| Entry Point | 1.2155 |
| Take Profit | 1.2234 |
| Stop Loss | 1.2110 |
| Key Levels | 1.1951, 1.2000, 1.2052, 1.2087, 1.2150, 1.2200, 1.2234, 1.2271 |
| Alternative scenario | |
|---|---|
| Recommendation | SELL STOP |
| Entry Point | 1.2085 |
| Take Profit | 1.2000 |
| Stop Loss | 1.2125 |
| Key Levels | 1.1951, 1.2000, 1.2052, 1.2087, 1.2150, 1.2200, 1.2234, 1.2271 |
Current trend
EUR is showing flat dynamics against USD during today's Asian session, testing 1.2130 for a breakout again. Investors expect new drivers to emerge on the market after updating local highs on EUR last week, but the picture remains the same so far. Market participants are concerned about the pace of economic recovery in the eurozone after the coronavirus epidemic, fearing that the current quarantine restrictions could slow this process, especially compared to the pace of growth of the US economy.
Some support for the instrument at the beginning of the week is provided by the macroeconomic data from the US published on Friday. Michigan Consumer Sentiment Index in February fell from 79 to 76.2 points with the forecast of growth to 80.8 points. Today, traders focus on statistics from the eurozone on the dynamics of industrial production and the trade balance for December.
Support and resistance
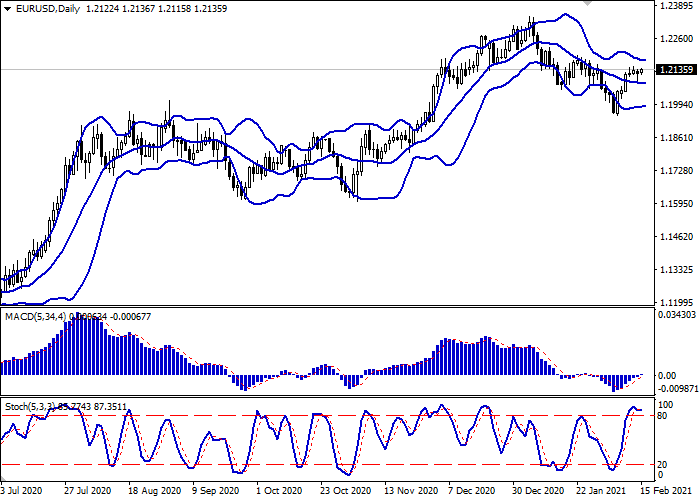
In the D1 chart, Bollinger Bands are reversing horizontally. The price range is slightly changing, being spacious enough for the current activity level in the market. MACD indicator is growing preserving a stable buy signal (located above the signal line). The indicator is also trying to consolidate above the zero level. Stochastic, having slightly retreated from its highs, reversed into a horizontal plane, reacting to the ambiguous trading dynamics at the end of last week.
To open new positions, it is necessary to wait for the trade signals to become clear.
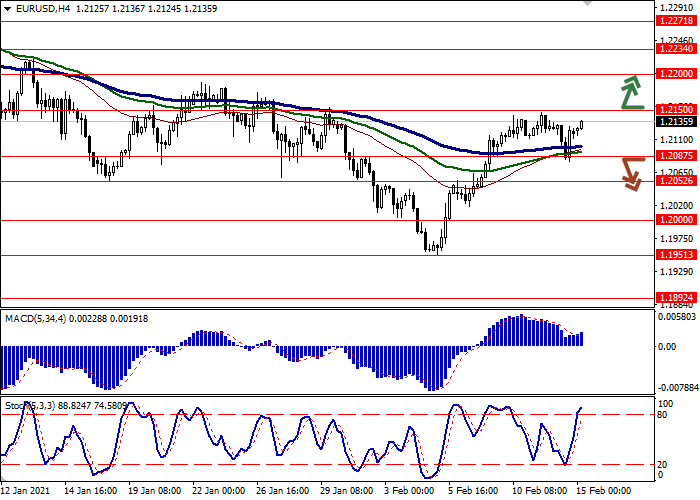
Resistance levels: 1.2150, 1.2200, 1.2234, 1.2271.
Support levels: 1.2087, 1.2052, 1.2000, 1.1951.
Trading tips
To open long positions, one can rely on the breakout of 1.2150. Take-profit – 1.2234. Stop-loss – 1.2110. Implementation time: 2-3 days.
The return of "bearish" trend with the breakdown of 1.2087 may become a signal for new sales with the target at 1.2000. Stop-loss – 1.2125.


No comments:
Write comments