
USD/JPY: the instrument is consolidating
18 February 2021, 08:40

| Scenario | |
|---|---|
| Timeframe | Intraday |
| Recommendation | SELL STOP |
| Entry Point | 105.55 |
| Take Profit | 104.75 |
| Stop Loss | 106.00 |
| Key Levels | 104.75, 105.17, 105.33, 105.60, 106.00, 106.25, 106.50 |
| Alternative scenario | |
|---|---|
| Recommendation | BUY STOP |
| Entry Point | 106.05 |
| Take Profit | 106.50 |
| Stop Loss | 105.70 |
| Key Levels | 104.75, 105.17, 105.33, 105.60, 106.00, 106.25, 106.50 |
Current trend
USD is showing a slight increase against JPY in trading this morning session, trying to win back some of the losses suffered the day before. USD is still supported by the positive macroeconomic data from the US on the dynamics of retail sales, released on Wednesday, and many analysts associate the appearance of negative dynamics only with technical factors.
Today, investors are focused on the statistics on the dynamics of jobless claims in the US. The indicator is expected to continue its moderate decline, reflecting the gradual recovery in the US labor market after the pandemic. It is also worth paying attention to the publication of data on the dynamics of building permits in January and the Philadelphia Fed Manufacturing Survey for February. Interesting statistics from Japan will appear only on Friday with the release of the inflation cut in January-February and Jibun Bank Manufacturing PMI for February.
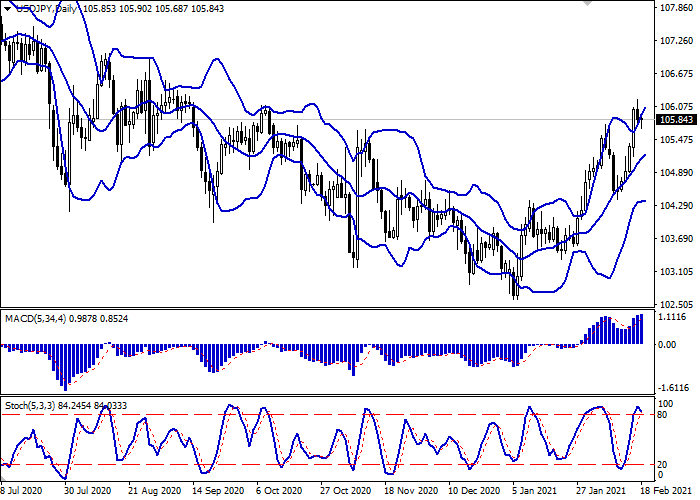
Support and resistance
Bollinger Bands in D1 chart show stable growth. The price range expands from above, pointing at a "bullish" potential in a short and medium term. MACD indicator is growing preserving a stable buy signal (located above the signal line). Stochastic, having approached its highs, reversed into the descending plane, indicating strongly overbought USD in the ultra-short term.
The development of a full-fledged correctional trend is possible in the short and/or ultra-short term.
Resistance levels: 106.00, 106.25, 106.50.
Support levels: 105.60, 105.33, 105.17, 104.75.
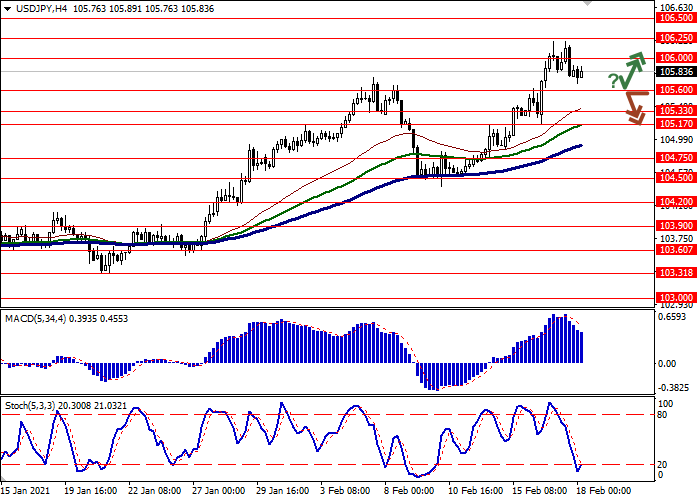
Trading tips
The breakdown of 105.60 may serve as a signal to new sales with the target at 104.75. Stop-loss – 106.00. Implementation time: 2-3 days.
To open long positions, one can rely on the rebound from the support level of 105.60, with the subsequent breakout of 106.00. Take-profit – 106.50. Stop-loss – 105.70.


No comments:
Write comments