
AUD/USD: technical analysis
15 January 2021, 11:45
| Scenario | |
|---|---|
| Timeframe | Intraday |
| Recommendation | BUY STOP |
| Entry Point | 0.7770 |
| Take Profit | 0.7820 |
| Stop Loss | 0.7740 |
| Key Levels | 0.7600, 0.7640, 0.7670, 0.7700, 0.7730, 0.7760, 0.7790, 0.7820 |
| Alternative scenario | |
|---|---|
| Recommendation | SELL STOP |
| Entry Point | 0.7720 |
| Take Profit | 0.7670 |
| Stop Loss | 0.7750 |
| Key Levels | 0.7600, 0.7640, 0.7670, 0.7700, 0.7730, 0.7760, 0.7790, 0.7820 |
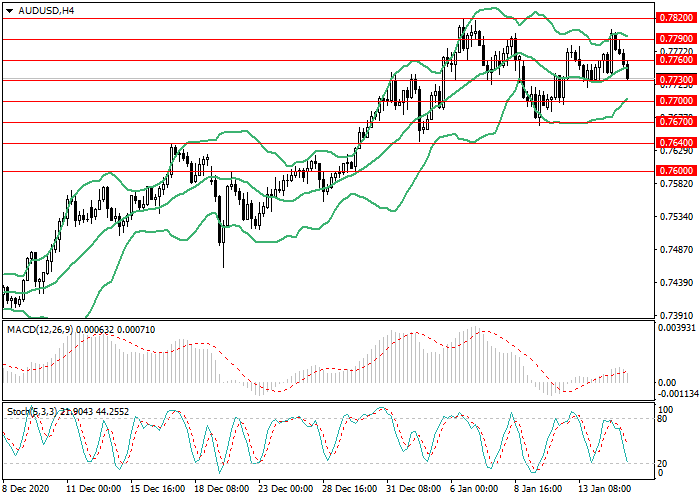
AUD/USD, H4
On the H4 chart, a lateral trend is forming. The instrument corrected to the center line of Bollinger Bands; the indicator cloud is narrowed and it is likely that lateral trend will persist in the short term. MACD histogram is in the positive area, its volumes are minimal; the signal line is directed horizontally without forming a clear signal to enter the market. Stochastic is in the neutral zone and the oscillator lines have reversed downwards from the border with the overbought zone, the sell signal is forming.
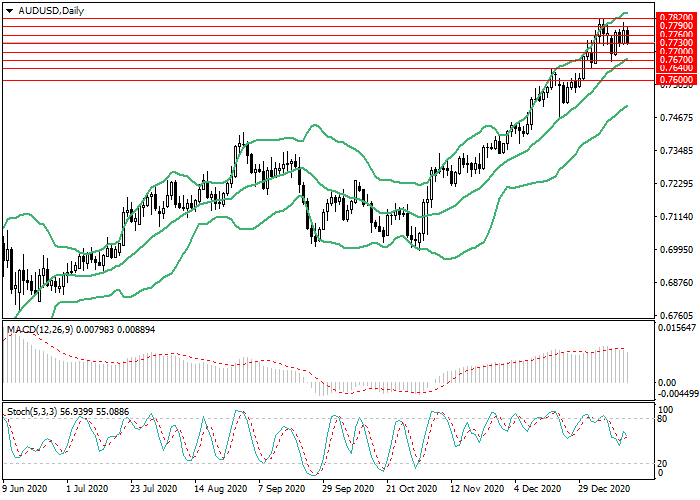
AUD/USD, D1
D1 chart shows the correction of upward movement. The instrument is trading between the upper and center lines of Bollinger Bands; the indicator cloud is expanded; the uptrend is likely to persist in the medium term. MACD histogram is in the positive zone preserving stable volumes and a steady signal for opening long positions. Stochastic is in the neutral area; the signal line is directed horizontally, without forming a definite signal to enter the market.

Key levels
Resistance levels: 0.7760, 0.7790, 0.7820.
Support levels: 0.7730, 0.7700, 0.7670, 0.7640, 0.7600.
Trading tips
Long positions may be opened from the level of 0.7770 with target at 0.7820 and stop-loss at 0.7740. Implementation time: 1-3 days.
Short positions may be opened from the level of 0.7720 with target at 0.7670. Stop-loss – 0.7750.


No comments:
Write comments