
Alphabet Inc. (GOOG/NASDAQ): general review
15 January 2021, 11:50
| Scenario | |
|---|---|
| Timeframe | Weekly |
| Recommendation | BUY STOP |
| Entry Point | 1833.0 |
| Take Profit | 1940.0 |
| Stop Loss | 1790.0 |
| Key Levels | 1524.0, 1697.0, 1832.0, 1940.0 |
| Alternative scenario | |
|---|---|
| Recommendation | SELL STOP |
| Entry Point | 1696.0 |
| Take Profit | 1524.0 |
| Stop Loss | 1750.0 |
| Key Levels | 1524.0, 1697.0, 1832.0, 1940.0 |
Current trend
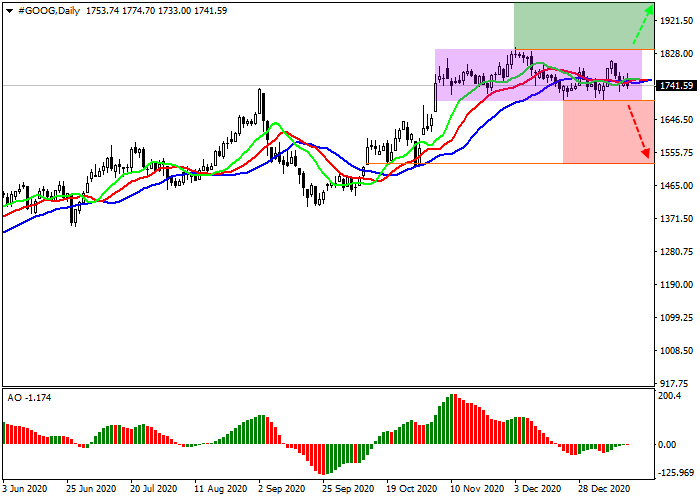
Alphabet Inc. shares continue to be in a correctional trend, trading at 1741.0.
The acquisition of European fitness tracker manufacturer Fitbit, worth USD 2.1 billion, by Alphabet Inc., which lasted more than a year, was finally completed. Back in mid-2019, the companies entered into a preliminary agreement, but the European Data Protection Council tried to block the deal on the pretext that it fears for the personal data of Europeans after they fall into the hands of Google. The European Commission still gave permission for the deal in December 2020, setting a number of conditions for the companies.
Support and resistance
The global uptrend continues to develop; at the moment a local sideways correction is being formed. Technical indicators have not issued a buy signal yet, but it's just a matter of time. The fluctuation range of the Alligator indicator EMAs is narrowed almost completely, and the histogram of the AO oscillator is very close to the transition level.
Resistance levels: 1832.0, 1940.0.
Support levels: 1697.0, 1524.0.

Trading tips
If the asset continues growing and the price consolidates above the resistance level of 1832.0, long positions will be relevant with target at 1940.0. Stop-loss – 1790.0. Implementation time: 7 days and more.
If the asset reverses and continues decline, and the price consolidates below the local support level at 1697.0, short positions can be opened with the target at 1524.0 and stop-loss at 1750.0.


No comments:
Write comments