USD/JPY: the dollar is being corrected
05 December 2019, 10:09
| Scenario | |
|---|---|
| Timeframe | Intraday |
| Recommendation | BUY STOP |
| Entry Point | 109.00, 109.10 |
| Take Profit | 109.47, 109.59 |
| Stop Loss | 108.80, 108.71 |
| Key Levels | 108.00, 108.22, 108.46, 108.71, 108.95, 109.06, 109.28, 109.47 |
| Alternative scenario | |
|---|---|
| Recommendation | SELL STOP |
| Entry Point | 108.65 |
| Take Profit | 108.22 |
| Stop Loss | 109.00 |
| Key Levels | 108.00, 108.22, 108.46, 108.71, 108.95, 109.06, 109.28, 109.47 |
Current trend
During today's Asian session, the USD/JPY pair shows ambiguous trading dynamics, consolidating after corrective growth the day before, thanks to which USD retreated from its local lows of November 21. The dollar strengthened, despite the appearance of ambiguous macroeconomic statistics from the US on Wednesday. So, ISM Service PMI for November fell from 54.7 to 53.9 points, which turned out to be noticeably worse than market expectations of 54.5 points. However, Composite PMI for the same period increased from 51.9 to 52 points. An additional negative point was the publication of the ADP report on private sector employment. In November, the indicator rose by 67K new jobs after an increase of 121K in the previous month. Analysts had expected a much more significant increase in the indicator – by 140K.
Support and resistance
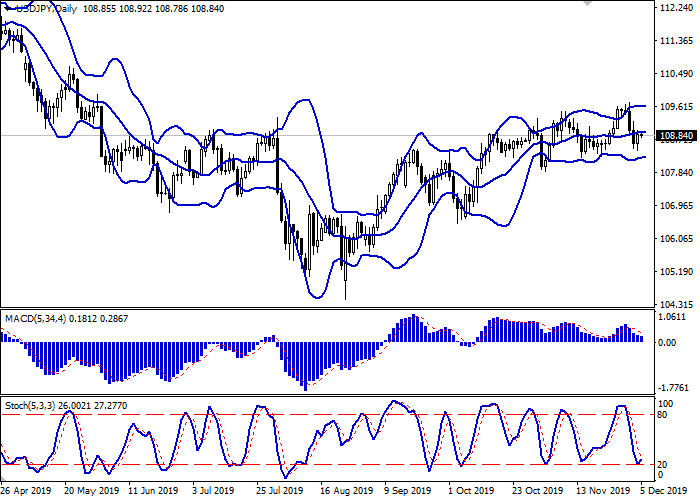
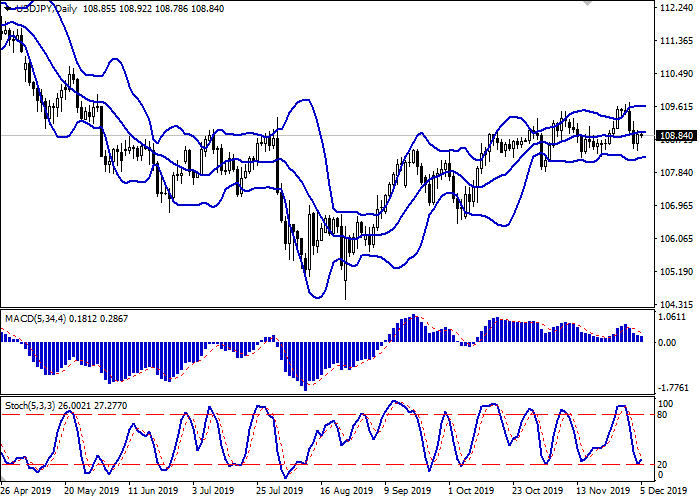
On the daily chart, Bollinger bands grow slightly. The price range narrows from below, reflecting the appearance of ambiguous dynamics in the ultra-short term. MACD falls, maintaining a moderate sell signal (the histogram is below the signal line). Stochastic, approaching the level of 20, reversed into an upward plane, indicating that the risks of corrective growth in the ultra-short term.
A corrective growth in the short and/or ultra-short term is possible in the near future.
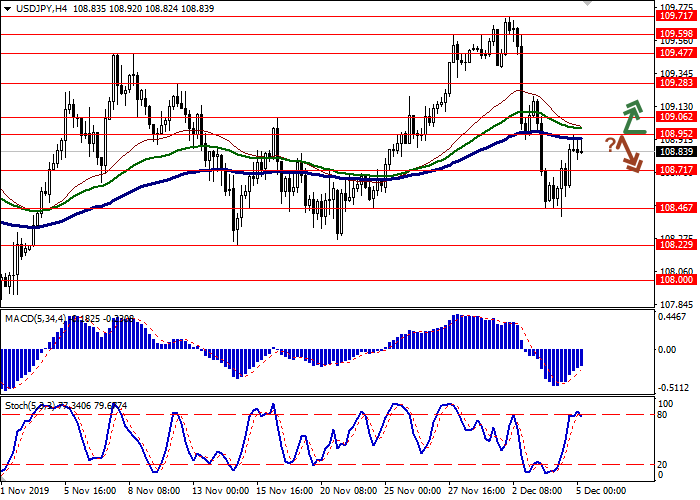
Resistance levels: 108.95, 109.06, 109.28, 109.47.
Support levels: 108.71, 108.46, 108.22, 108.00.


Trading tips
Long positions may be opened after the breakout of 108.95 or 109.06 with the target at 109.47 or 109.59. Stop loss – 108.80–108.71.
Short positions may be opened after a rebound from 108.95 and a breakdown of 108.71 with the target at 108.22. Stop loss is no further than 109.00.
Implementation period: 2–3 days.
During today's Asian session, the USD/JPY pair shows ambiguous trading dynamics, consolidating after corrective growth the day before, thanks to which USD retreated from its local lows of November 21. The dollar strengthened, despite the appearance of ambiguous macroeconomic statistics from the US on Wednesday. So, ISM Service PMI for November fell from 54.7 to 53.9 points, which turned out to be noticeably worse than market expectations of 54.5 points. However, Composite PMI for the same period increased from 51.9 to 52 points. An additional negative point was the publication of the ADP report on private sector employment. In November, the indicator rose by 67K new jobs after an increase of 121K in the previous month. Analysts had expected a much more significant increase in the indicator – by 140K.
Support and resistance
On the daily chart, Bollinger bands grow slightly. The price range narrows from below, reflecting the appearance of ambiguous dynamics in the ultra-short term. MACD falls, maintaining a moderate sell signal (the histogram is below the signal line). Stochastic, approaching the level of 20, reversed into an upward plane, indicating that the risks of corrective growth in the ultra-short term.
A corrective growth in the short and/or ultra-short term is possible in the near future.
Resistance levels: 108.95, 109.06, 109.28, 109.47.
Support levels: 108.71, 108.46, 108.22, 108.00.


Trading tips
Long positions may be opened after the breakout of 108.95 or 109.06 with the target at 109.47 or 109.59. Stop loss – 108.80–108.71.
Short positions may be opened after a rebound from 108.95 and a breakdown of 108.71 with the target at 108.22. Stop loss is no further than 109.00.
Implementation period: 2–3 days.


No comments:
Write comments