
NZD/USD: New Zealand dollar is correcting
16 December 2019, 10:54
| Scenario | |
|---|---|
| Timeframe | Intraday |
| Recommendation | BUY STOP |
| Entry Point | 0.6640 |
| Take Profit | 0.6700, 0.6720 |
| Stop Loss | 0.6600, 0.6585 |
| Key Levels | 0.6500, 0.6521, 0.6539, 0.6573, 0.6602, 0.6634, 0.6685 |
| Alternative scenario | |
|---|---|
| Recommendation | SELL STOP |
| Entry Point | 0.6570 |
| Take Profit | 0.6500, 0.6464 |
| Stop Loss | 0.6634 |
| Key Levels | 0.6500, 0.6521, 0.6539, 0.6573, 0.6602, 0.6634, 0.6685 |
Current trend
NZD shows flat trading dynamics during the Asian session, consolidating near the local highs, updated last Friday. The pair grew rather actively at the end of last week, responding to reports of the signing of the first phase of a trade agreement between the US and China, but the instrument failed to consolidate at the new local highs.
Moderate pressure on NZD today is exerted by the Business NZ Performance of Services Index. In November, the index fell from 55.4 to 53.3 points, which turned out to be worse than expectations. In turn, Chinese statistics support the pair slightly. Industrial Production in China in November increased by 6.2% YoY after growth of 4.7% YoY a month earlier. Analysts had expected growth by 5% YoY. Retail Sales for the same period increased by 8% YoY after rising by 7.2% YoY a month earlier. The forecast assumed an increase of 7.6% YoY.
Support and resistance
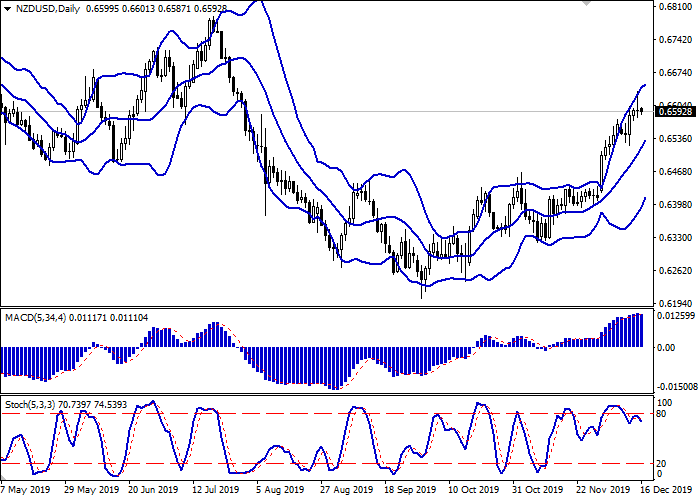
Bollinger Bands in D1 chart show active growth. The price range is narrowing, reflecting the emergence of ambiguous trading dynamics in the short term. MACD indicator is reversing downwards and tries to form a new sell signal (the histogram should consolidate below the signal line). Stochastic also maintains a downtrend, retreating from its highs, indicating the risks of overbought NZD in the ultra-short term.
The development of a full-fledged downtrend is possible in the short and/or ultra-short term.
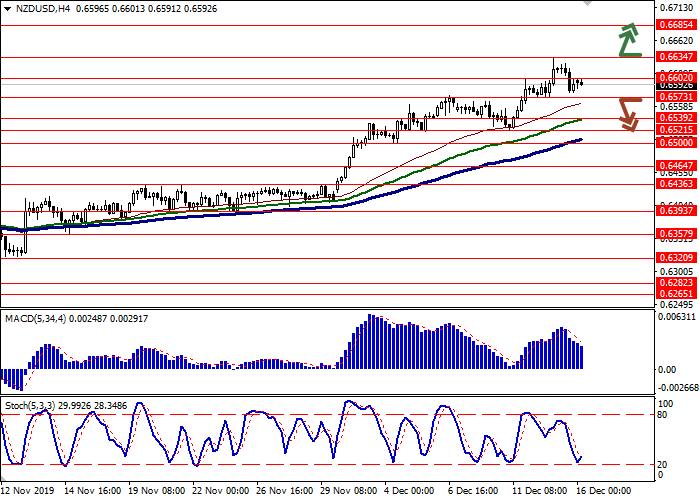
Resistance levels: 0.6602, 0.6634, 0.6685.
Support levels: 0.6573, 0.6539, 0.6521, 0.6500.
Trading tips
To open long positions, one can rely on the breakout of 0.6634. Take profit – 0.6700 or 0.6720. Stop loss – 0.6600 or 0.6585.
A breakdown of 0.6573 may be a signal for new sales with target at 0.6500 or 0.6464. Stop loss – 0.6634.
Implementation time: 2-3 days.
NZD shows flat trading dynamics during the Asian session, consolidating near the local highs, updated last Friday. The pair grew rather actively at the end of last week, responding to reports of the signing of the first phase of a trade agreement between the US and China, but the instrument failed to consolidate at the new local highs.
Moderate pressure on NZD today is exerted by the Business NZ Performance of Services Index. In November, the index fell from 55.4 to 53.3 points, which turned out to be worse than expectations. In turn, Chinese statistics support the pair slightly. Industrial Production in China in November increased by 6.2% YoY after growth of 4.7% YoY a month earlier. Analysts had expected growth by 5% YoY. Retail Sales for the same period increased by 8% YoY after rising by 7.2% YoY a month earlier. The forecast assumed an increase of 7.6% YoY.
Support and resistance
Bollinger Bands in D1 chart show active growth. The price range is narrowing, reflecting the emergence of ambiguous trading dynamics in the short term. MACD indicator is reversing downwards and tries to form a new sell signal (the histogram should consolidate below the signal line). Stochastic also maintains a downtrend, retreating from its highs, indicating the risks of overbought NZD in the ultra-short term.
The development of a full-fledged downtrend is possible in the short and/or ultra-short term.
Resistance levels: 0.6602, 0.6634, 0.6685.
Support levels: 0.6573, 0.6539, 0.6521, 0.6500.
Trading tips
To open long positions, one can rely on the breakout of 0.6634. Take profit – 0.6700 or 0.6720. Stop loss – 0.6600 or 0.6585.
A breakdown of 0.6573 may be a signal for new sales with target at 0.6500 or 0.6464. Stop loss – 0.6634.
Implementation time: 2-3 days.


No comments:
Write comments