Facebook Inc. (FB/NASD): general analysis
06 December 2019, 11:19
| Scenario | |
|---|---|
| Timeframe | Intraday |
| Recommendation | SELL STOP |
| Entry Point | 197.00 |
| Take Profit | 192.00, 187.00, 183.00 |
| Stop Loss | 202.00 |
| Key Levels | 182.00, 189.00, 197.00, 203.50, 208.50 |
| Alternative scenario | |
|---|---|
| Recommendation | BUY STOP |
| Entry Point | 203.50 |
| Take Profit | 214.00, 218.00 |
| Stop Loss | 198.00 |
| Key Levels | 182.00, 189.00, 197.00, 203.50, 208.50 |
Current trend
Facebook shares have added 3.2% since mid-November and are currently trading near a 4-month high with a 3.6% discount to a 52-week high of July 25. This week, analysts at Stifel investment company raised their recommendation on Facebook shares, expecting stabilization of revenue growth in 2020 against the backdrop of the company's successful investment in advertising initiatives.
Facebook stocks fell by 1.31% over the past week. The S&P 500 index fell by 1.15% over the same period.
Support and resistance
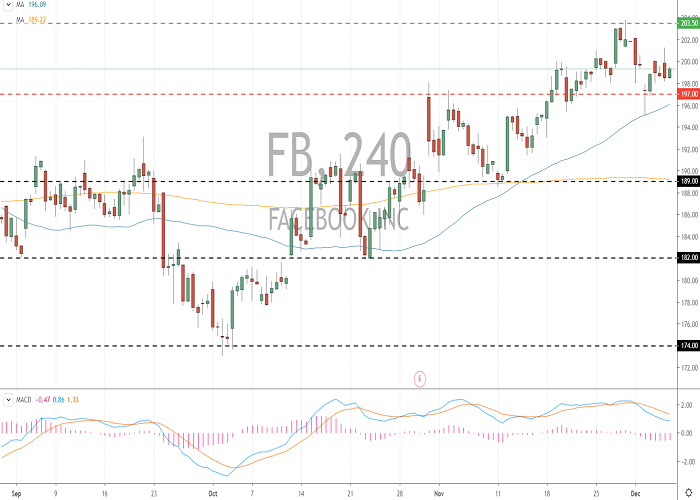
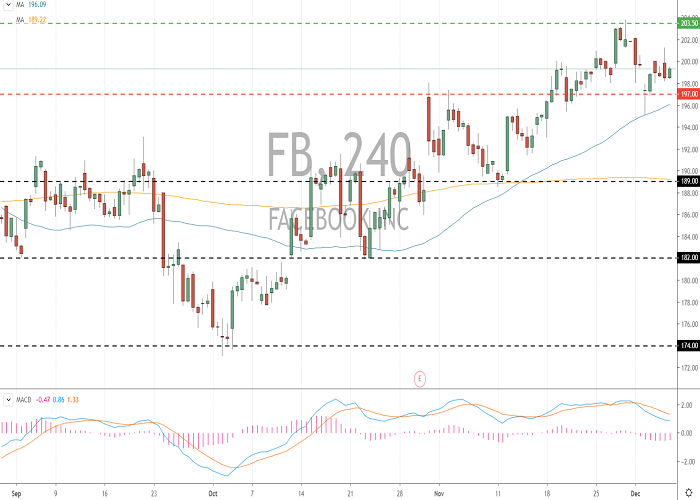
The company's shares stabilized after a protracted growth. #FB quotes are currently consolidating. There is no unidirectional trend observed. The key range is 197.00–203.50. In the near future, technical correction of the trading instrument is not ruled out. The signals of the indicators differ: the price fixed above MA (50) and MA (200); MACD began to decline. It is better to open the positions from the key levels.
A comparative analysis of the multiples of the company and competing companies indicates the neutrality of #FB.
Resistance levels: 203.50, 208.50.
Support levels: 197.00, 189.00, 182.00.

Trading tips
Short positions may be opened after the price consolidates below the level of 197.00. The closing of the profitable positions is possible at the levels of 192.00, 187.00 and 183.00. Stop loss – 202.00.
Long positions may be opened after the price consolidates above the level of 203.50 with the targets at 214.00–218.00. Stop loss – 198.00.
Implementation period: 3 days.
Facebook shares have added 3.2% since mid-November and are currently trading near a 4-month high with a 3.6% discount to a 52-week high of July 25. This week, analysts at Stifel investment company raised their recommendation on Facebook shares, expecting stabilization of revenue growth in 2020 against the backdrop of the company's successful investment in advertising initiatives.
Facebook stocks fell by 1.31% over the past week. The S&P 500 index fell by 1.15% over the same period.
Support and resistance
The company's shares stabilized after a protracted growth. #FB quotes are currently consolidating. There is no unidirectional trend observed. The key range is 197.00–203.50. In the near future, technical correction of the trading instrument is not ruled out. The signals of the indicators differ: the price fixed above MA (50) and MA (200); MACD began to decline. It is better to open the positions from the key levels.
A comparative analysis of the multiples of the company and competing companies indicates the neutrality of #FB.
Resistance levels: 203.50, 208.50.
Support levels: 197.00, 189.00, 182.00.

Trading tips
Short positions may be opened after the price consolidates below the level of 197.00. The closing of the profitable positions is possible at the levels of 192.00, 187.00 and 183.00. Stop loss – 202.00.
Long positions may be opened after the price consolidates above the level of 203.50 with the targets at 214.00–218.00. Stop loss – 198.00.
Implementation period: 3 days.


No comments:
Write comments