Brent Crude Oil: general analysis
04 December 2019, 09:46
| Scenario | |
|---|---|
| Timeframe | Weekly |
| Recommendation | SELL STOP |
| Entry Point | 61.40 |
| Take Profit | 59.60 |
| Stop Loss | 62.50 |
| Key Levels | 59.60, 61.40, 62.70, 64.40 |
| Alternative scenario | |
|---|---|
| Recommendation | BUY STOP |
| Entry Point | 62.70 |
| Take Profit | 64.40 |
| Stop Loss | 61.20 |
| Key Levels | 59.60, 61.40, 62.70, 64.40 |
Current trend
Oil quotes are falling, as traders are focused on today’s data on energy reserves. The indicator is projected to decrease by –1.798M against the increase by 1.572M last week, which is unlikely, as the index has been growing for the eighth week in a row. The next meeting of OPEC, scheduled for Thursday, will affect the instrument, too.
The spread in the arbitrage position between the WTI Crude Oil and Brent Crude Oil reached a record level of $4.8, which was expected and suggests that a long-term large position has been practically formed, and a sharp movement is expected soon. Considering the spread and statistical data, it is worthwhile to assume a high probability of the price breaking the lower border of the ascending channel and falling below the psychological level of $60 per barrel.
Support and resistance
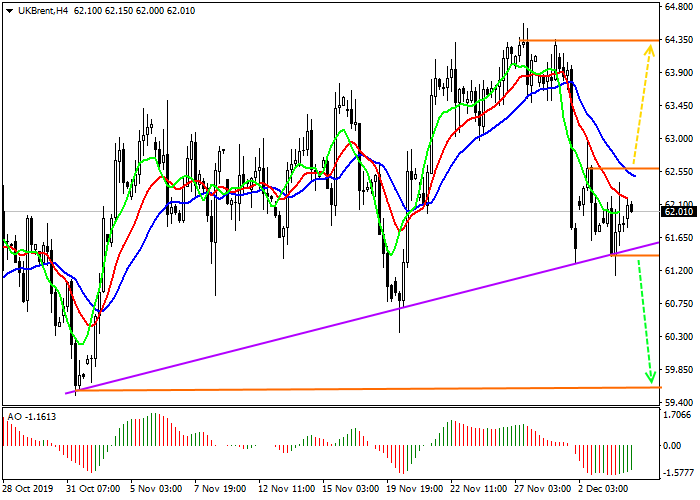
The price is close to the support line of the global “expanding formation” pattern. It may speak of future growth but there two important factors deny it. It is the sixth pattern wave, which statistically most often breaks one of the borders. Also, the OPEC meeting is close and macroeconomic data are ambiguous.
In general, it is better to form pending orders and open positions, focusing on price movements.
Resistance levels: 62.70, 64.40.
Support levels: 61.40, 59.60.

Trading tips
After the decline and consolidation below the pattern support line at 61.40, it is better to open sell positions with a target at 59.60. Stop loss is inside the passed pattern, around 62.50.
After the reversal, growth, or consolidations above 62.70, buy positions with the target at 64.40 will be relevant. Stop loss is below the line of support for the pattern, around 61.20.
Implementation period: 7 days or more.
Oil quotes are falling, as traders are focused on today’s data on energy reserves. The indicator is projected to decrease by –1.798M against the increase by 1.572M last week, which is unlikely, as the index has been growing for the eighth week in a row. The next meeting of OPEC, scheduled for Thursday, will affect the instrument, too.
The spread in the arbitrage position between the WTI Crude Oil and Brent Crude Oil reached a record level of $4.8, which was expected and suggests that a long-term large position has been practically formed, and a sharp movement is expected soon. Considering the spread and statistical data, it is worthwhile to assume a high probability of the price breaking the lower border of the ascending channel and falling below the psychological level of $60 per barrel.
Support and resistance
The price is close to the support line of the global “expanding formation” pattern. It may speak of future growth but there two important factors deny it. It is the sixth pattern wave, which statistically most often breaks one of the borders. Also, the OPEC meeting is close and macroeconomic data are ambiguous.
In general, it is better to form pending orders and open positions, focusing on price movements.
Resistance levels: 62.70, 64.40.
Support levels: 61.40, 59.60.

Trading tips
After the decline and consolidation below the pattern support line at 61.40, it is better to open sell positions with a target at 59.60. Stop loss is inside the passed pattern, around 62.50.
After the reversal, growth, or consolidations above 62.70, buy positions with the target at 64.40 will be relevant. Stop loss is below the line of support for the pattern, around 61.20.
Implementation period: 7 days or more.


No comments:
Write comments