AUD/USD: Australian dollar is going down
05 December 2019, 10:14
| Scenario | |
|---|---|
| Timeframe | Intraday |
| Recommendation | BUY STOP |
| Entry Point | 0.6850 |
| Take Profit | 0.6881, 0.6900 |
| Stop Loss | 0.6820 |
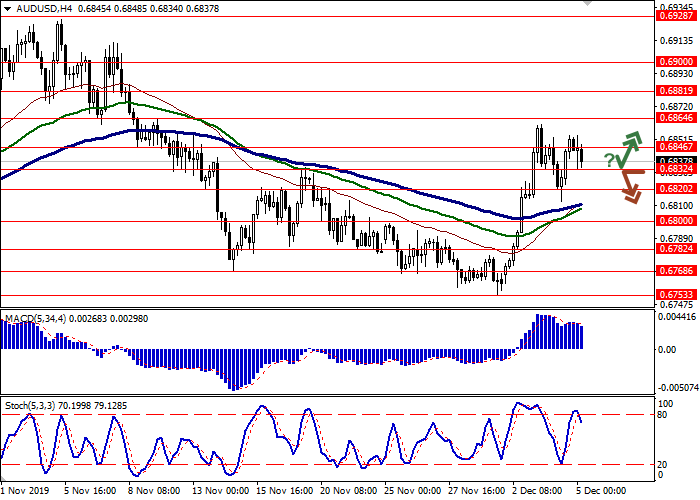
| Key Levels | 0.6782, 0.6800, 0.6820, 0.6832, 0.6846, 0.6864, 0.6881, 0.6900 |
| Alternative scenario | |
|---|---|
| Recommendation | SELL STOP |
| Entry Point | 0.6830 |
| Take Profit | 0.6800, 0.6782 |
| Stop Loss | 0.6860 |
| Key Levels | 0.6782, 0.6800, 0.6820, 0.6832, 0.6846, 0.6864, 0.6881, 0.6900 |
Current trend
AUD shows negative dynamics during today's Asian session, declining by about 0.24%. The instrument responds to the publication of disappointing macroeconomic statistics from Australia. Australia's Retail Sales in October showed zero dynamics after rising by 0.2% MoM in September. Analysts had expected acceleration of the increase to 0.3% MoM. Exports from Australia in October showed a 5% decline after rising by 3% a month earlier. Imports for the same period showed zero dynamics after an increase of 3% in September. Such a significant drop in exports led to a marked decrease in the surplus of the trade balance. In October, the balance amounted to 4.5B Australian dollars after 7.2B in September. Analysts had expected a balance surplus of AUD 6.1B.
Support and resistance
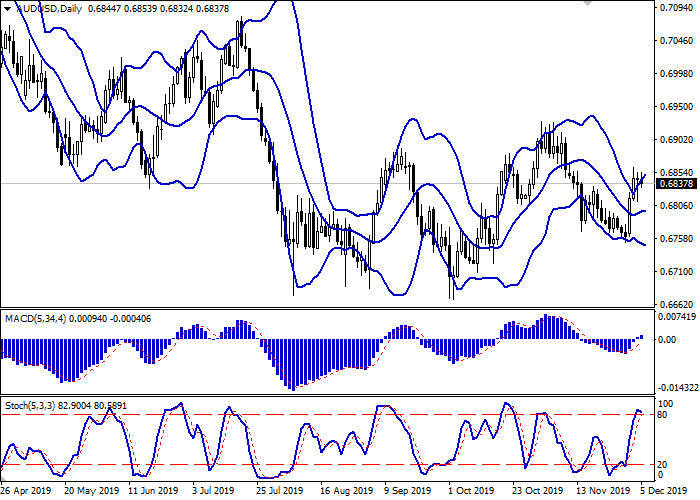
In the D1 chart, Bollinger Bands are reversing horizontally. The price range expands, freeing a path to new local highs for the "bulls". MACD indicator is growing preserving a moderate buy signal (located above the signal line). The indicator is also trying to consolidate above the zero level. Stochastic, approaching its highs is inclined to reverse to a descending plane, pointing to the risks of corrective dynamics in the ultra-short term.
It is necessary to wait for the clarification of trade signals from the indicators to open new positions.
Resistance levels: 0.6846, 0.6864, 0.6881, 0.6900.
Support levels: 0.6832, 0.6820, 0.6800, 0.6782.


Trading tips
To open long positions, one can rely on the rebound from 0.6832 as from support with the subsequent breakout of 0.6846. Take profit – 0.6881 or 0.6900. Stop loss – 0.6820.
A breakdown of 0.6832 may be a signal for new sales with target at 0.6800 or 0.6782. Stop loss – 0.6860.
Implementation time: 2-3 days.
AUD shows negative dynamics during today's Asian session, declining by about 0.24%. The instrument responds to the publication of disappointing macroeconomic statistics from Australia. Australia's Retail Sales in October showed zero dynamics after rising by 0.2% MoM in September. Analysts had expected acceleration of the increase to 0.3% MoM. Exports from Australia in October showed a 5% decline after rising by 3% a month earlier. Imports for the same period showed zero dynamics after an increase of 3% in September. Such a significant drop in exports led to a marked decrease in the surplus of the trade balance. In October, the balance amounted to 4.5B Australian dollars after 7.2B in September. Analysts had expected a balance surplus of AUD 6.1B.
Support and resistance
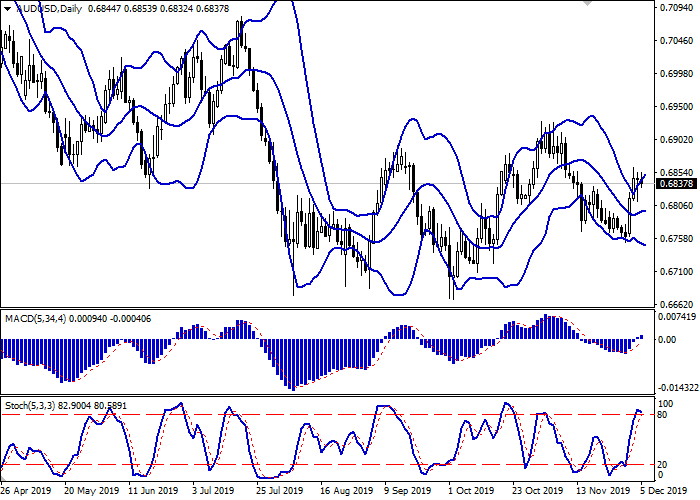
In the D1 chart, Bollinger Bands are reversing horizontally. The price range expands, freeing a path to new local highs for the "bulls". MACD indicator is growing preserving a moderate buy signal (located above the signal line). The indicator is also trying to consolidate above the zero level. Stochastic, approaching its highs is inclined to reverse to a descending plane, pointing to the risks of corrective dynamics in the ultra-short term.
It is necessary to wait for the clarification of trade signals from the indicators to open new positions.
Resistance levels: 0.6846, 0.6864, 0.6881, 0.6900.
Support levels: 0.6832, 0.6820, 0.6800, 0.6782.


Trading tips
To open long positions, one can rely on the rebound from 0.6832 as from support with the subsequent breakout of 0.6846. Take profit – 0.6881 or 0.6900. Stop loss – 0.6820.
A breakdown of 0.6832 may be a signal for new sales with target at 0.6800 or 0.6782. Stop loss – 0.6860.
Implementation time: 2-3 days.


No comments:
Write comments