XAG/USD: silver prices rose
08 August 2019, 09:36
| Scenario | |
|---|---|
| Timeframe | Intraday |
| Recommendation | BUY STOP |
| Entry Point | 17.25 |
| Take Profit | 17.53, 17.70 |
| Stop Loss | 17.00 |
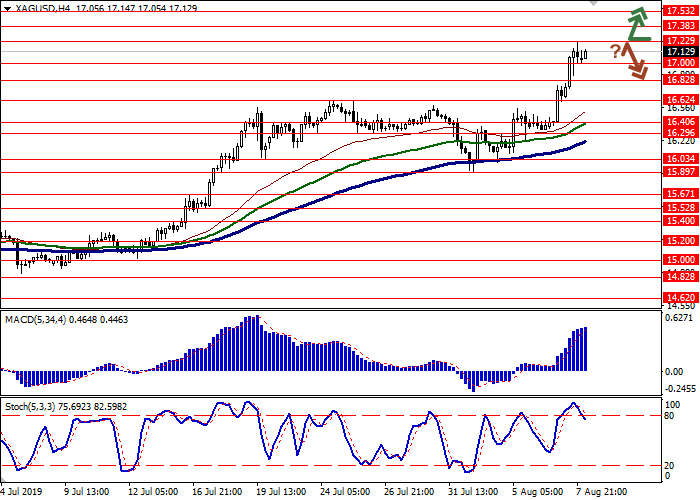
| Key Levels | 16.40, 16.62, 16.82, 17.00, 17.22, 17.38, 17.53 |
| Alternative scenario | |
|---|---|
| Recommendation | SELL STOP |
| Entry Point | 16.97 |
| Take Profit | 16.40, 16.29 |
| Stop Loss | 17.22 |
| Key Levels | 16.40, 16.62, 16.82, 17.00, 17.22, 17.38, 17.53 |
Current trend
Yesterday, silver prices rose steadily, renewing record lows from June 2018. The instrument is supported by a sharp decline in investor interest in risk amid a worsening of trade relations between the US and China, which threatens a new slowdown in the global economy. In addition, the course was positively influenced by the actions of the world's leading Central Banks aimed at stimulating the economy and lowering interest rates. So, on Wednesday, the RBNZ cut the rate by 50 basis points due to the worsening prospects for the global economy.
Support and resistance
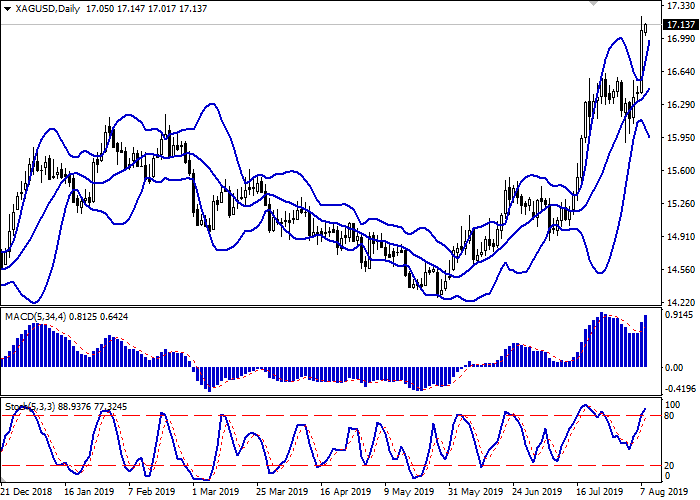
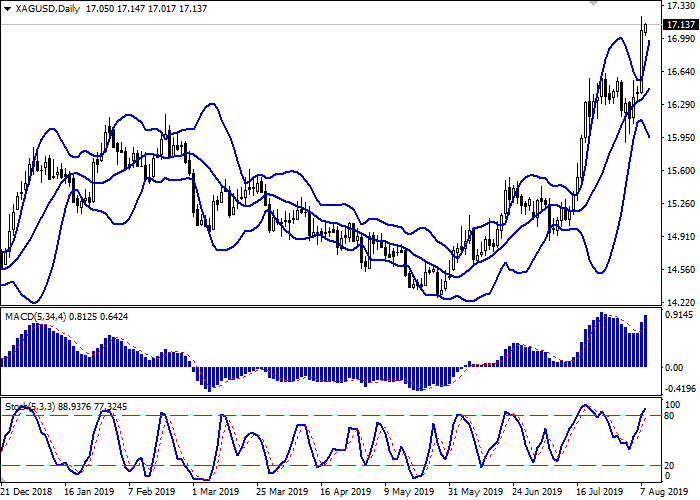
On the daily chart, Bollinger bands are growing moderately. The price range is actively expanding but not as fast as the “bullish” mood develops. The MACD indicator has reversed upwards, having formed a confident buy signal (the histogram is above the signal line). Stochastic maintains an upward direction but is approaching its highs, which signals that the instrument is overbought in the ultra-short term.
It is better to keep current long positions and not to open new ones until the market situation becomes clear.
Resistance levels: 17.22, 17.38, 17.53.
Support levels: 17.00, 16.82, 16.62, 16.40.


Trading tips
Long positions can be opened after the breakout of the level of 17.22 with the targets at 17.53–17.70. It is reasonable to place stop loss no further than 17.00. Implementation period: 1–2 days.
Short positions can be opened after a rebound from the level of 17.22 and a breakdown of the level of 17.00 with the targets at 16.40–16.29. Stop loss is 17.22. Implementation period: 2–3 days.
Yesterday, silver prices rose steadily, renewing record lows from June 2018. The instrument is supported by a sharp decline in investor interest in risk amid a worsening of trade relations between the US and China, which threatens a new slowdown in the global economy. In addition, the course was positively influenced by the actions of the world's leading Central Banks aimed at stimulating the economy and lowering interest rates. So, on Wednesday, the RBNZ cut the rate by 50 basis points due to the worsening prospects for the global economy.
Support and resistance
On the daily chart, Bollinger bands are growing moderately. The price range is actively expanding but not as fast as the “bullish” mood develops. The MACD indicator has reversed upwards, having formed a confident buy signal (the histogram is above the signal line). Stochastic maintains an upward direction but is approaching its highs, which signals that the instrument is overbought in the ultra-short term.
It is better to keep current long positions and not to open new ones until the market situation becomes clear.
Resistance levels: 17.22, 17.38, 17.53.
Support levels: 17.00, 16.82, 16.62, 16.40.


Trading tips
Long positions can be opened after the breakout of the level of 17.22 with the targets at 17.53–17.70. It is reasonable to place stop loss no further than 17.00. Implementation period: 1–2 days.
Short positions can be opened after a rebound from the level of 17.22 and a breakdown of the level of 17.00 with the targets at 16.40–16.29. Stop loss is 17.22. Implementation period: 2–3 days.


No comments:
Write comments