
XAU/USD: gold prices are correcting
22 July 2019, 09:44
| Scenario | |
|---|---|
| Timeframe | Intraday |
| Recommendation | BUY STOP |
| Entry Point | 1430.10, 1439.20 |
| Take Profit | 1452.66, 1460.00 |
| Stop Loss | 1425.00, 1420.00 |
| Key Levels | 1357.90, 1381.50, 1400.60, 1414.36, 1426.91, 1439.11, 1452.66 |
| Alternative scenario | |
|---|---|
| Recommendation | SELL STOP |
| Entry Point | 1414.30 |
| Take Profit | 1381.50 |
| Stop Loss | 1426.91 |
| Key Levels | 1357.90, 1381.50, 1400.60, 1414.36, 1426.91, 1439.11, 1452.66 |
Current trend
Gold prices declined significantly on July 19 after a renewal of six-year highs amid an increase in the likelihood of the Fed lowering interest rates at the end of July. A number of representatives of the regulator, for example, John Williams and Richard Clarida, spoke in favor of a faster rate cut, which would help the US economy to cope with problems without waiting for the development of a large-scale economic crisis. Investors already expected the Fed to take steps to stimulate monetary policy. Now the chances of lowering rates have increased markedly.
Additional support for gold is provided by the uncertainty surrounding the US-China trade negotiations. For a long time, the parties have not reached a consensus, and the rhetoric of officials has begun to deteriorate in recent days.
Support and resistance
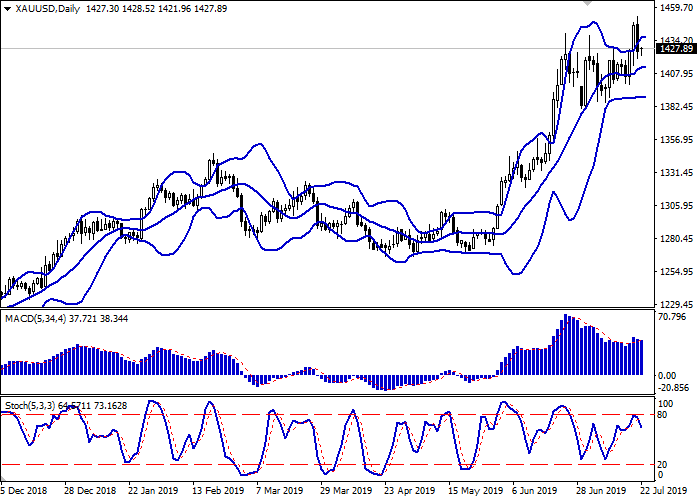
On the D1 chart, Bollinger Bands are reversing horizontally. The price range is almost unchanged, indicating the emergence of ambiguous trading dynamics in the short term. MACD is going down preserving a weak sell signal (being located under the signal line). Stochastic, approaching the level of 80, showed a downward reversal, responding to the powerful "bearish" impulse formed on Friday.
There's a possibility of a downtrend in the short and/or ultra-short term.
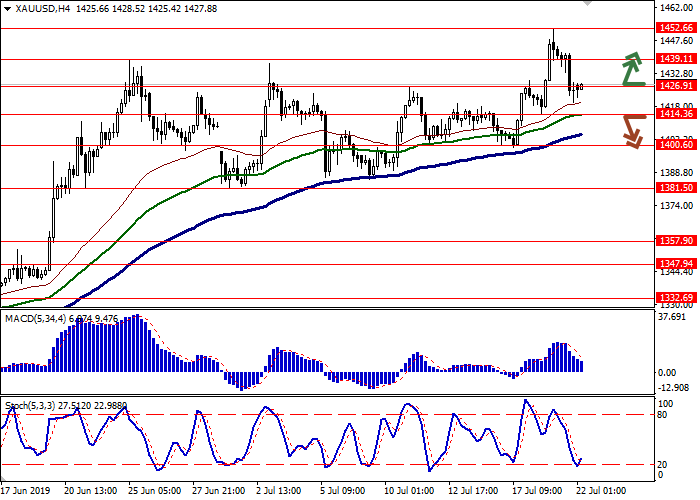
Resistance levels: 1426.91, 1439.11, 1452.66.
Support levels: 1414.36, 1400.60, 1381.50, 1357.90.
Trading tips
To open long positions, one can rely on the breakout of 1430.00 or 1439.11. Take profit – 1452.66 or 1460.00. Stop loss – 1425.00 or 1420.00.
The return of "bearish" dynamics with the breakdown of 1414.36 may become a signal to start sales with the target at 1381.50. Stop loss – 1426.91.
Implementation period: 2-3 days.
Gold prices declined significantly on July 19 after a renewal of six-year highs amid an increase in the likelihood of the Fed lowering interest rates at the end of July. A number of representatives of the regulator, for example, John Williams and Richard Clarida, spoke in favor of a faster rate cut, which would help the US economy to cope with problems without waiting for the development of a large-scale economic crisis. Investors already expected the Fed to take steps to stimulate monetary policy. Now the chances of lowering rates have increased markedly.
Additional support for gold is provided by the uncertainty surrounding the US-China trade negotiations. For a long time, the parties have not reached a consensus, and the rhetoric of officials has begun to deteriorate in recent days.
Support and resistance
On the D1 chart, Bollinger Bands are reversing horizontally. The price range is almost unchanged, indicating the emergence of ambiguous trading dynamics in the short term. MACD is going down preserving a weak sell signal (being located under the signal line). Stochastic, approaching the level of 80, showed a downward reversal, responding to the powerful "bearish" impulse formed on Friday.
There's a possibility of a downtrend in the short and/or ultra-short term.
Resistance levels: 1426.91, 1439.11, 1452.66.
Support levels: 1414.36, 1400.60, 1381.50, 1357.90.
Trading tips
To open long positions, one can rely on the breakout of 1430.00 or 1439.11. Take profit – 1452.66 or 1460.00. Stop loss – 1425.00 or 1420.00.
The return of "bearish" dynamics with the breakdown of 1414.36 may become a signal to start sales with the target at 1381.50. Stop loss – 1426.91.
Implementation period: 2-3 days.


No comments:
Write comments