
NZD/USD: New Zealand dollar consolidates
22 July 2019, 09:55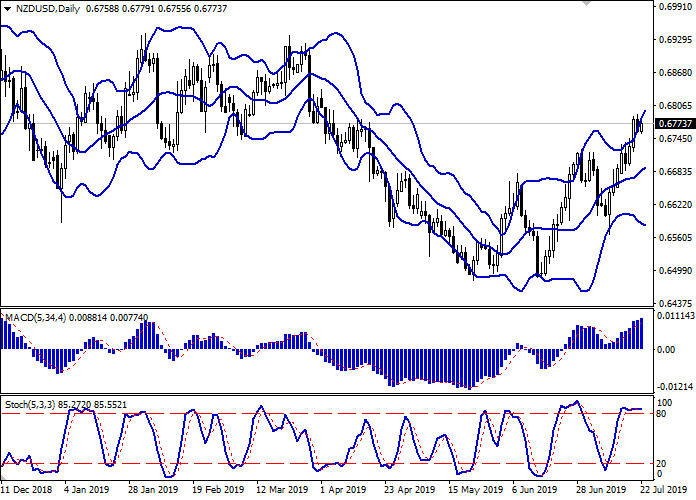
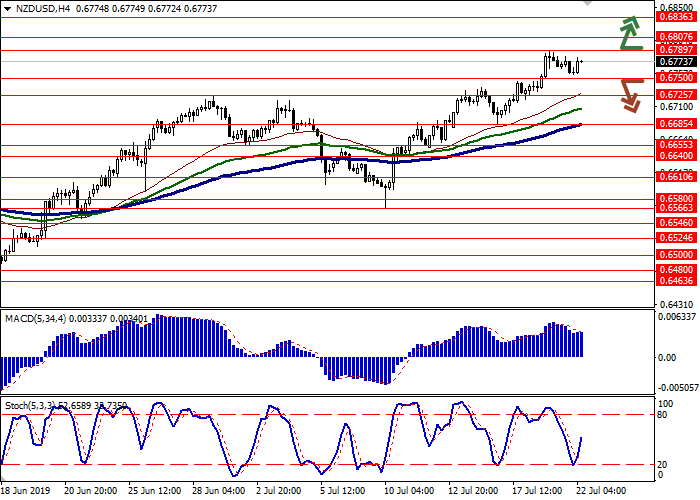
| Scenario | |
|---|---|
| Timeframe | Intraday |
| Recommendation | BUY STOP |
| Entry Point | 0.6795 |
| Take Profit | 0.6850, 0.6872 |
| Stop Loss | 0.6760 |
| Key Levels | 0.6655, 0.6685, 0.6725, 0.6750, 0.6789, 0.6807, 0.6836, 0.6872 |
| Alternative scenario | |
|---|---|
| Recommendation | SELL STOP |
| Entry Point | 0.6745 |
| Take Profit | 0.6655, 0.6640 |
| Stop Loss | 0.6789 |
| Key Levels | 0.6655, 0.6685, 0.6725, 0.6750, 0.6789, 0.6807, 0.6836, 0.6872 |
Current trend
On Friday, the NZD/USD pair fell, retreating from the renewed local highs. The dynamic was of a technical nature since the macroeconomic background remained the same. NZD was moderately supported by credit card spending data. In June, the figure rose by 6.6% YoY, which was only 0.1% weaker than last month. Investors expected a growth rate of only 5.4% YoY. USD, in turn, was under pressure after a speech by representatives of the US Federal Reserve, who noted the positive effect of the rapid interest rate cut. In late July, a large two-day Fed meeting will take place, at which, as investors expect, the interest rate will be lowered.
Support and resistance
Bollinger bands are growing steadily on the daily chart. The price range is actively expanding, letting the “bulls” renew local highs. The MACD indicator is growing, keeping a moderate buy signal (the histogram is above the signal line). Stochastic, approaching its highs, reversed into a horizontal plane, indicating that NZD may become overbought in the super short term.
The developing a corrective decline is possible in the short and/or ultra-short term.
Resistance levels: 0.6789, 0.6807, 0.6836, 0.6872.
Support levels: 0.6750, 0.6725, 0.6685, 0.6655.

Trading tips
Long positions can be opened after the breakout of the level 0.6789 with the targets at 0.6850–0.6872. Stop loss is 0.6760. Implementation period: 1–2 days.
Short positions can be opened after the breakdown of the level 0.6750 with the target at 0.6655 or 0.6640. Stop loss is 0.6789. Implementation period: 2–3 days.
On Friday, the NZD/USD pair fell, retreating from the renewed local highs. The dynamic was of a technical nature since the macroeconomic background remained the same. NZD was moderately supported by credit card spending data. In June, the figure rose by 6.6% YoY, which was only 0.1% weaker than last month. Investors expected a growth rate of only 5.4% YoY. USD, in turn, was under pressure after a speech by representatives of the US Federal Reserve, who noted the positive effect of the rapid interest rate cut. In late July, a large two-day Fed meeting will take place, at which, as investors expect, the interest rate will be lowered.
Support and resistance
Bollinger bands are growing steadily on the daily chart. The price range is actively expanding, letting the “bulls” renew local highs. The MACD indicator is growing, keeping a moderate buy signal (the histogram is above the signal line). Stochastic, approaching its highs, reversed into a horizontal plane, indicating that NZD may become overbought in the super short term.
The developing a corrective decline is possible in the short and/or ultra-short term.
Resistance levels: 0.6789, 0.6807, 0.6836, 0.6872.
Support levels: 0.6750, 0.6725, 0.6685, 0.6655.
Trading tips
Long positions can be opened after the breakout of the level 0.6789 with the targets at 0.6850–0.6872. Stop loss is 0.6760. Implementation period: 1–2 days.
Short positions can be opened after the breakdown of the level 0.6750 with the target at 0.6655 or 0.6640. Stop loss is 0.6789. Implementation period: 2–3 days.


No comments:
Write comments