USD/CHF: the dollar resumed its decline
03 July 2019, 09:55
| Scenario | |
|---|---|
| Timeframe | Intraday |
| Recommendation | BUY STOP |
| Entry Point | 0.9865, 0.9880 |
| Take Profit | 0.9960, 1.0000 |
| Stop Loss | 0.9830 |
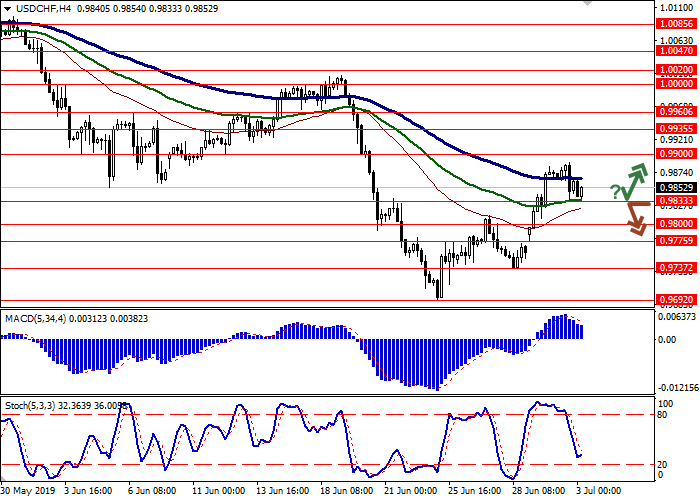
| Key Levels | 0.9737, 0.9775, 0.9800, 0.9833, 0.9900, 0.9935, 0.9960, 1.0000 |
| Alternative scenario | |
|---|---|
| Recommendation | SELL STOP |
| Entry Point | 0.9830 |
| Take Profit | 0.9737 |
| Stop Loss | 0.9870 |
| Key Levels | 0.9737, 0.9775, 0.9800, 0.9833, 0.9900, 0.9935, 0.9960, 1.0000 |
Current trend
Yesterday, USD fell moderately against CHF, departing from new highs of June 20. The negative dynamics was largely technical in nature since USD grew steadily at the end of the last trading week. Published on Tuesday, US macroeconomic statistics moderately supported the instrument. Thus, the ISM New York business conditions index rose from 58.6 to 50.0 points in June. The IBD/TIPP economic optimism index for the same period strengthened from 53.2 to 56.6 points, which was better than the average market expectations.
Today, during the Asian session, the pair keeps the dynamic. Investors are focused on the US block of macroeconomic statistics on business activity and production orders. Interesting data from Switzerland will appear only on Thursday when the June consumer inflation is released.
Support and resistance
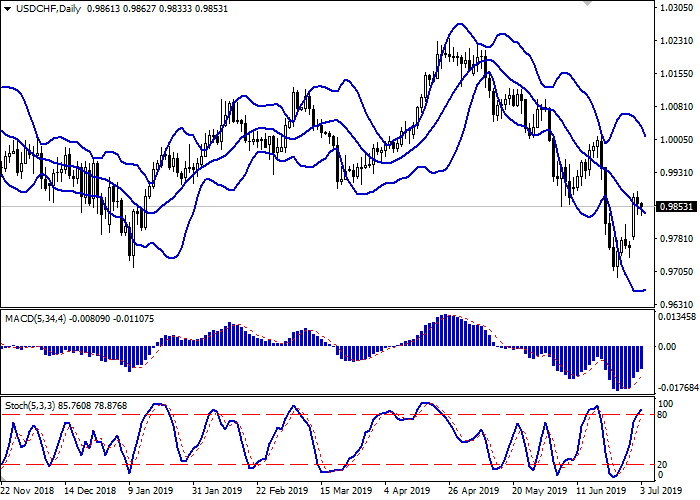
On the daily chart, Bollinger bands steadily decline. The price range narrows below, reflecting the emergence of ambiguous trading dynamics in the super-short term. The MACD grows, keeping a strong buy signal (the histogram is above the signal line). Stochastic is directed upwards but is rapidly approaching its highs, which indicates that USD can become overbought in the super-short term.
It is better to keep s part of current long positions for some time and wait for clarification of the situation before opening new ones.
Resistance levels: 0.9900, 0.9935, 0.9960, 1.0000.
Support levels: 0.9833, 0.9800, 0.9775, 0.9737.


Trading tips
Long positions can be opened after a rebound from 0.9833 and a breakout of 0.9860–0.9875 with the target at 0.9960 or 1.0000. Stop loss is 0.9830.
Short positions can be opened after the breakdown of 0.9833 with the target at 0.9737. Stop loss is 0.9870.
Implementation period: 2–3 days.
Yesterday, USD fell moderately against CHF, departing from new highs of June 20. The negative dynamics was largely technical in nature since USD grew steadily at the end of the last trading week. Published on Tuesday, US macroeconomic statistics moderately supported the instrument. Thus, the ISM New York business conditions index rose from 58.6 to 50.0 points in June. The IBD/TIPP economic optimism index for the same period strengthened from 53.2 to 56.6 points, which was better than the average market expectations.
Today, during the Asian session, the pair keeps the dynamic. Investors are focused on the US block of macroeconomic statistics on business activity and production orders. Interesting data from Switzerland will appear only on Thursday when the June consumer inflation is released.
Support and resistance
On the daily chart, Bollinger bands steadily decline. The price range narrows below, reflecting the emergence of ambiguous trading dynamics in the super-short term. The MACD grows, keeping a strong buy signal (the histogram is above the signal line). Stochastic is directed upwards but is rapidly approaching its highs, which indicates that USD can become overbought in the super-short term.
It is better to keep s part of current long positions for some time and wait for clarification of the situation before opening new ones.
Resistance levels: 0.9900, 0.9935, 0.9960, 1.0000.
Support levels: 0.9833, 0.9800, 0.9775, 0.9737.


Trading tips
Long positions can be opened after a rebound from 0.9833 and a breakout of 0.9860–0.9875 with the target at 0.9960 or 1.0000. Stop loss is 0.9830.
Short positions can be opened after the breakdown of 0.9833 with the target at 0.9737. Stop loss is 0.9870.
Implementation period: 2–3 days.


No comments:
Write comments