NZD/USD: Fibonacci analysis
04 July 2019, 13:54
| Scenario | |
|---|---|
| Timeframe | Weekly |
| Recommendation | SELL STOP |
| Entry Point | 0.6660 |
| Take Profit | 0.6610, 0.6588 |
| Stop Loss | 0.6690 |
| Key Levels | 0.6588, 0.6610, 0.6664, 0.6718, 0.6750, 0.6815 |
| Alternative scenario | |
|---|---|
| Recommendation | BUY STOP |
| Entry Point | 0.6720 |
| Take Profit | 0.6750, 0.6815 |
| Stop Loss | 0.6695 |
| Key Levels | 0.6588, 0.6610, 0.6664, 0.6718, 0.6750, 0.6815 |
NZD/USD, H4
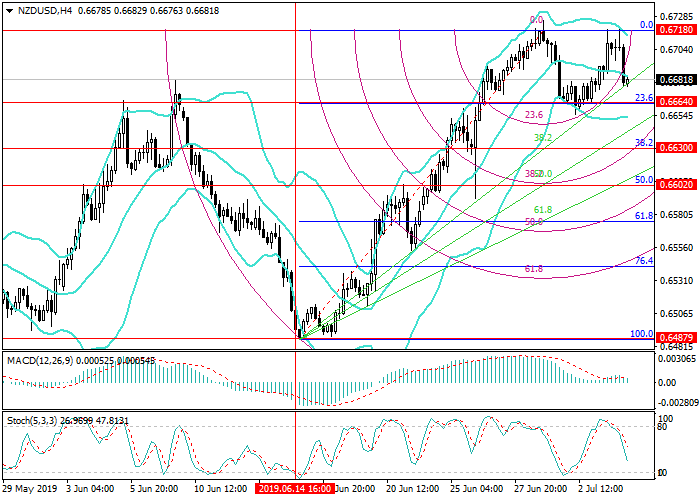
On the H4 chart, the price reversed near 0.6718 (ratio 0.0%) and is preparing to re-test the level of 0.6664 (ratio 23.6%). If successful, the decline may continue to 0.6630 (ratio 38.2%) and 0.6602 (ratio 50.0%), but to do this, the price will have to break through an upward fan. Technical indicators generally allow a decline: Bollinger Bands are reversing down, MACD histogram decreases in the negative zone, while Stochastic is pointing downwards.

NZD/USD, D1
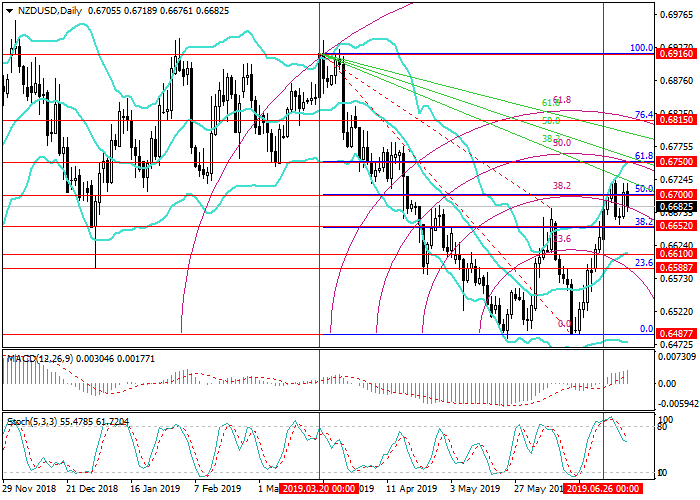
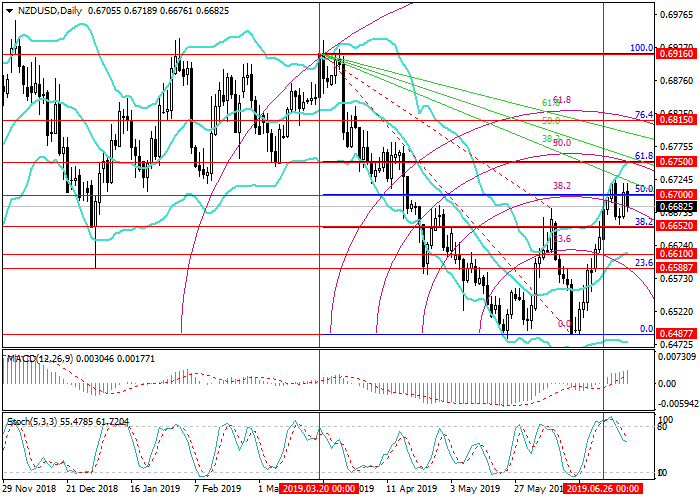
On the D1 chart, the price for the second week unsuccessfully tests the level of 0.6700 (ratio 61.8%). The instrument is pressured by a downward correctional fan. With the development of a downward correction, quotes may fall to 0.6610 (the midline of Bollinger Bands) and 0.6588 (ratio 23.6%). If the price consolidates above the level of 0.6700 and the downward fan line of 38.2%, growth can continue to 0.6750 (ratio 61.8%) and 0.6815 (ratio 74.6%). Technical indicators show opposing signals: Bollinger Bands are directed upwards confirming the uptrend, MACD histogram grows in the positive zone, and Stochastic is pointing down.

Support and resistance
In the short term, a continuation of the correction to 0.6610–0.6588 (cluster of corrections 50.0% H4, 23.6% D1, the midline of Bollinger Bands) is likely. However, in the medium term, growth may resume to the levels of 0.6750 (ratio 61.8% D1) and 0.6815 (ratio 74.6% D1).
Support levels: 0.6664, 0.6610, 0.6588.
Resistance levels: 0.6718, 0.6750, 0.6815.
Trading tips
Short positions may be opened below 0.6664 with targets at 0.6610, 0.6588 and stop loss at 0.6690.
Long positions may be opened from the level of 0.6720 with targets at 0.6750, 0.6815 and stop loss at 0.6695.
Implementation period: 4-5 days.
On the H4 chart, the price reversed near 0.6718 (ratio 0.0%) and is preparing to re-test the level of 0.6664 (ratio 23.6%). If successful, the decline may continue to 0.6630 (ratio 38.2%) and 0.6602 (ratio 50.0%), but to do this, the price will have to break through an upward fan. Technical indicators generally allow a decline: Bollinger Bands are reversing down, MACD histogram decreases in the negative zone, while Stochastic is pointing downwards.

NZD/USD, D1
On the D1 chart, the price for the second week unsuccessfully tests the level of 0.6700 (ratio 61.8%). The instrument is pressured by a downward correctional fan. With the development of a downward correction, quotes may fall to 0.6610 (the midline of Bollinger Bands) and 0.6588 (ratio 23.6%). If the price consolidates above the level of 0.6700 and the downward fan line of 38.2%, growth can continue to 0.6750 (ratio 61.8%) and 0.6815 (ratio 74.6%). Technical indicators show opposing signals: Bollinger Bands are directed upwards confirming the uptrend, MACD histogram grows in the positive zone, and Stochastic is pointing down.

Support and resistance
In the short term, a continuation of the correction to 0.6610–0.6588 (cluster of corrections 50.0% H4, 23.6% D1, the midline of Bollinger Bands) is likely. However, in the medium term, growth may resume to the levels of 0.6750 (ratio 61.8% D1) and 0.6815 (ratio 74.6% D1).
Support levels: 0.6664, 0.6610, 0.6588.
Resistance levels: 0.6718, 0.6750, 0.6815.
Trading tips
Short positions may be opened below 0.6664 with targets at 0.6610, 0.6588 and stop loss at 0.6690.
Long positions may be opened from the level of 0.6720 with targets at 0.6750, 0.6815 and stop loss at 0.6695.
Implementation period: 4-5 days.


No comments:
Write comments