Brent Crude Oil: oil is growing
01 July 2019, 09:30
| Scenario | |
|---|---|
| Timeframe | Intraday |
| Recommendation | BUY |
| Entry Point | 67.22 |
| Take Profit | 69.31, 70.00 |
| Stop Loss | 65.98 |
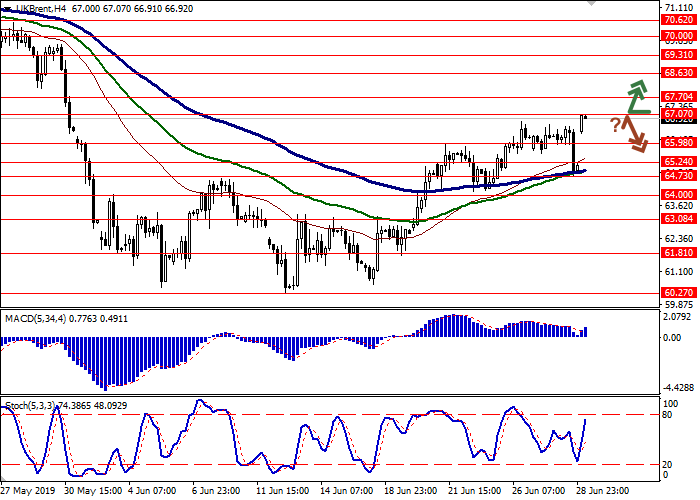
| Key Levels | 64.00, 64.73, 65.24, 65.98, 67.07, 67.70, 68.63, 69.31 |
| Alternative scenario | |
|---|---|
| Recommendation | SELL STOP |
| Entry Point | 65.90 |
| Take Profit | 64.00 |
| Stop Loss | 67.07 |
| Key Levels | 64.00, 64.73, 65.24, 65.98, 67.07, 67.70, 68.63, 69.31 |
Current trend
Oil prices are rising moderately today, recovering from a noticeable correction at the end of last week. Quotes are supported by the OPEC+ meeting, which will start on Monday. Following the meeting, the cartel is expected to decide to extend the existing agreement on the limitation of supplies. Moreover, the agreement can be expanded and supplemented with new mechanisms for regulating supply on the market. At the G20 summit, which took place last weekend in Osaka, Russia managed to negotiate with Saudi Arabia to extend the deal for 6-9 months. The Russian Minister of Energy, Alexander Novak, commenting on this decision, also noted that Russia in June reduced oil production slightly more than it was required by the OPEC+ deal.
Support and resistance
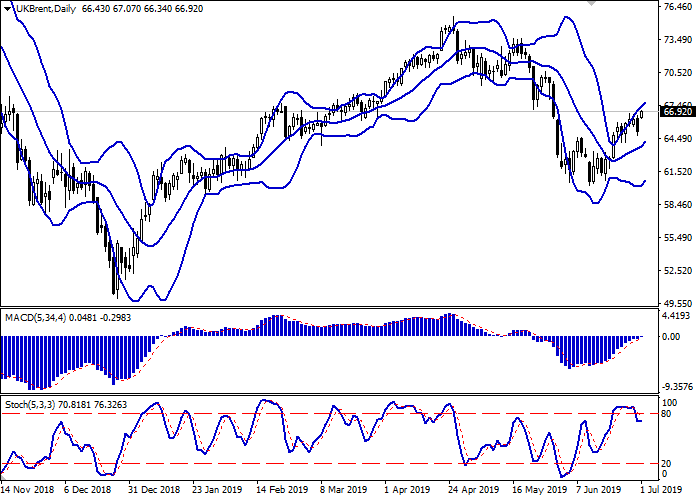
Bollinger Bands in the D1 chart demonstrate growth. The price range is narrowing, reflecting the ambiguous nature of trading at the end of the week. MACD indicator is growing preserving a stable buy signal (the histogram is above the signal line). Moreover, the indicator is trying to consolidate above the zero line. Stochastic, departing from its maximum values, again reversed horizontally, responding to the resumption of growth today.
The showings of the indicators do not contradict the further development of the upward trend in the short and/or ultra-short term.
Resistance levels: 67.07, 67.70, 68.63, 69.31.
Support levels: 65.98, 65.24, 64.73, 64.00.


Trading tips
To open long positions, one can rely on the breakout of 67.07. Take profit — 69.31 or 70.00. Stop loss – 65.98.
A rebound from 67.07, as from resistance, followed by a breakdown of 65.98, may become a signal for returning to the sales with the target at 64.00. Stop loss – 67.07.
Implementation period: 2-3 days.
Oil prices are rising moderately today, recovering from a noticeable correction at the end of last week. Quotes are supported by the OPEC+ meeting, which will start on Monday. Following the meeting, the cartel is expected to decide to extend the existing agreement on the limitation of supplies. Moreover, the agreement can be expanded and supplemented with new mechanisms for regulating supply on the market. At the G20 summit, which took place last weekend in Osaka, Russia managed to negotiate with Saudi Arabia to extend the deal for 6-9 months. The Russian Minister of Energy, Alexander Novak, commenting on this decision, also noted that Russia in June reduced oil production slightly more than it was required by the OPEC+ deal.
Support and resistance
Bollinger Bands in the D1 chart demonstrate growth. The price range is narrowing, reflecting the ambiguous nature of trading at the end of the week. MACD indicator is growing preserving a stable buy signal (the histogram is above the signal line). Moreover, the indicator is trying to consolidate above the zero line. Stochastic, departing from its maximum values, again reversed horizontally, responding to the resumption of growth today.
The showings of the indicators do not contradict the further development of the upward trend in the short and/or ultra-short term.
Resistance levels: 67.07, 67.70, 68.63, 69.31.
Support levels: 65.98, 65.24, 64.73, 64.00.


Trading tips
To open long positions, one can rely on the breakout of 67.07. Take profit — 69.31 or 70.00. Stop loss – 65.98.
A rebound from 67.07, as from resistance, followed by a breakdown of 65.98, may become a signal for returning to the sales with the target at 64.00. Stop loss – 67.07.
Implementation period: 2-3 days.


No comments:
Write comments