Brent Crude Oil: general analysis
11 July 2019, 14:59
| Scenario | |
|---|---|
| Timeframe | Weekly |
| Recommendation | BUY |
| Entry Point | 67.70 |
| Take Profit | 68.75, 70.30 |
| Stop Loss | 66.80 |
| Key Levels | 62.50, 64.00, 65.62, 68.75, 70.30 |
| Alternative scenario | |
|---|---|
| Recommendation | SELL STOP |
| Entry Point | 65.55 |
| Take Profit | 64.00, 62.50 |
| Stop Loss | 66.50 |
| Key Levels | 62.50, 64.00, 65.62, 68.75, 70.30 |
Current trend
Oil price grows and is currently trading around 67.60 due to the growing tension in the Middle East and EIA weekly report. US oil reserves dropped sharply for the fourth time in a row, by 9.488 million barrels. Gasoline inventories decreased by 1.455 million barrels, while distillates increased by 3.729 million barrels. Yesterday, the British authorities said that several Iranian boats of the Islamic Revolutionary Guard Corps tried to stop the British tanker British Heritage, which was sailing through the Strait of Hormuz. The ship was ordered to stop but after a warning from the British frigate HMS Montrose, which accompanied the tanker, the Iranian boats were forced to retreat. Islamic Republic’s fleet representatives stated that they had not had any clashes with foreign ships over the past 24 hours, and Iranian Foreign Minister Javad Zarif noted that the British themselves create tensions in the region with their statements. The recent incidents involving attacks on tankers in the Persian Gulf made investors doubt the uninterrupted supply of oil.
Support and resistance
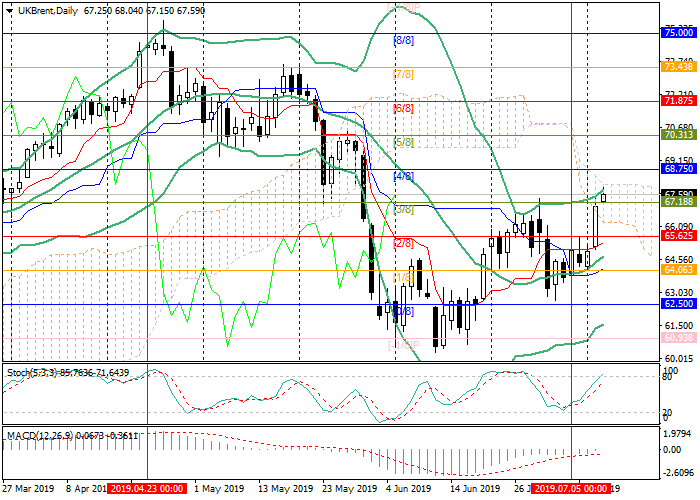
The price grew above 67.18 (Murrey [3/8]) and may reach 68.75 (Murrey [4/8]) and 70.30 (Murrey [5/8]). The key “bearish” level is 65.62 (Murrey [2/8]). After consolidation below it, the price may fall to 64.00 (Murrey [1/8]) and 62.50 (Murrey [0/8]).
Technical indicators confirm the possibility of growth. Bollinger bands and Stochastic are directed upwards. The MACD is ready to enter the positive zone and form a buy signal.
Resistance levels: 68.75, 70.30.
Support levels: 65.62, 64.00, 62.50.

Trading tips
Long positions can be opened from the current level with the targets at 68.75, 70.30 and stop loss 66.50.
Short positions can be opened below 65.62 with the targets at 64.00, 62.50 and stop loss 66.50.
Implementation period: 4–5 days.
Oil price grows and is currently trading around 67.60 due to the growing tension in the Middle East and EIA weekly report. US oil reserves dropped sharply for the fourth time in a row, by 9.488 million barrels. Gasoline inventories decreased by 1.455 million barrels, while distillates increased by 3.729 million barrels. Yesterday, the British authorities said that several Iranian boats of the Islamic Revolutionary Guard Corps tried to stop the British tanker British Heritage, which was sailing through the Strait of Hormuz. The ship was ordered to stop but after a warning from the British frigate HMS Montrose, which accompanied the tanker, the Iranian boats were forced to retreat. Islamic Republic’s fleet representatives stated that they had not had any clashes with foreign ships over the past 24 hours, and Iranian Foreign Minister Javad Zarif noted that the British themselves create tensions in the region with their statements. The recent incidents involving attacks on tankers in the Persian Gulf made investors doubt the uninterrupted supply of oil.
Support and resistance
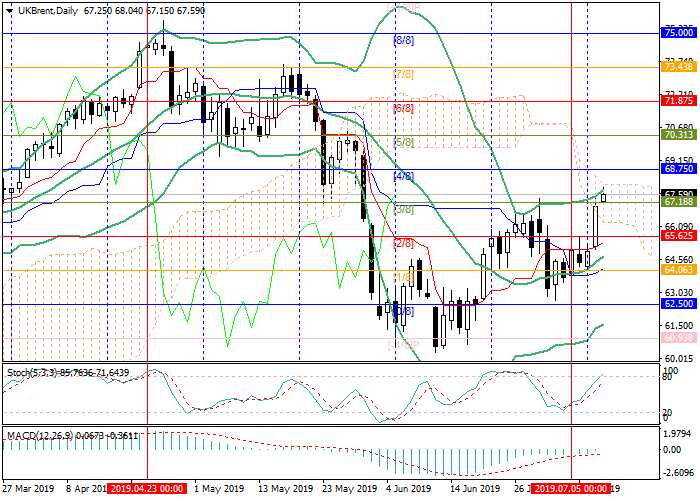
The price grew above 67.18 (Murrey [3/8]) and may reach 68.75 (Murrey [4/8]) and 70.30 (Murrey [5/8]). The key “bearish” level is 65.62 (Murrey [2/8]). After consolidation below it, the price may fall to 64.00 (Murrey [1/8]) and 62.50 (Murrey [0/8]).
Technical indicators confirm the possibility of growth. Bollinger bands and Stochastic are directed upwards. The MACD is ready to enter the positive zone and form a buy signal.
Resistance levels: 68.75, 70.30.
Support levels: 65.62, 64.00, 62.50.

Trading tips
Long positions can be opened from the current level with the targets at 68.75, 70.30 and stop loss 66.50.
Short positions can be opened below 65.62 with the targets at 64.00, 62.50 and stop loss 66.50.
Implementation period: 4–5 days.


No comments:
Write comments